System Health
The System Health Monitor provides real-time visibility into the operational status of all RhythmX services, system resources, and database performance. Use this page to verify that all components are running correctly and to identify potential bottlenecks.
From the Security Control Center, click View Health on the System Health widget.
Overview
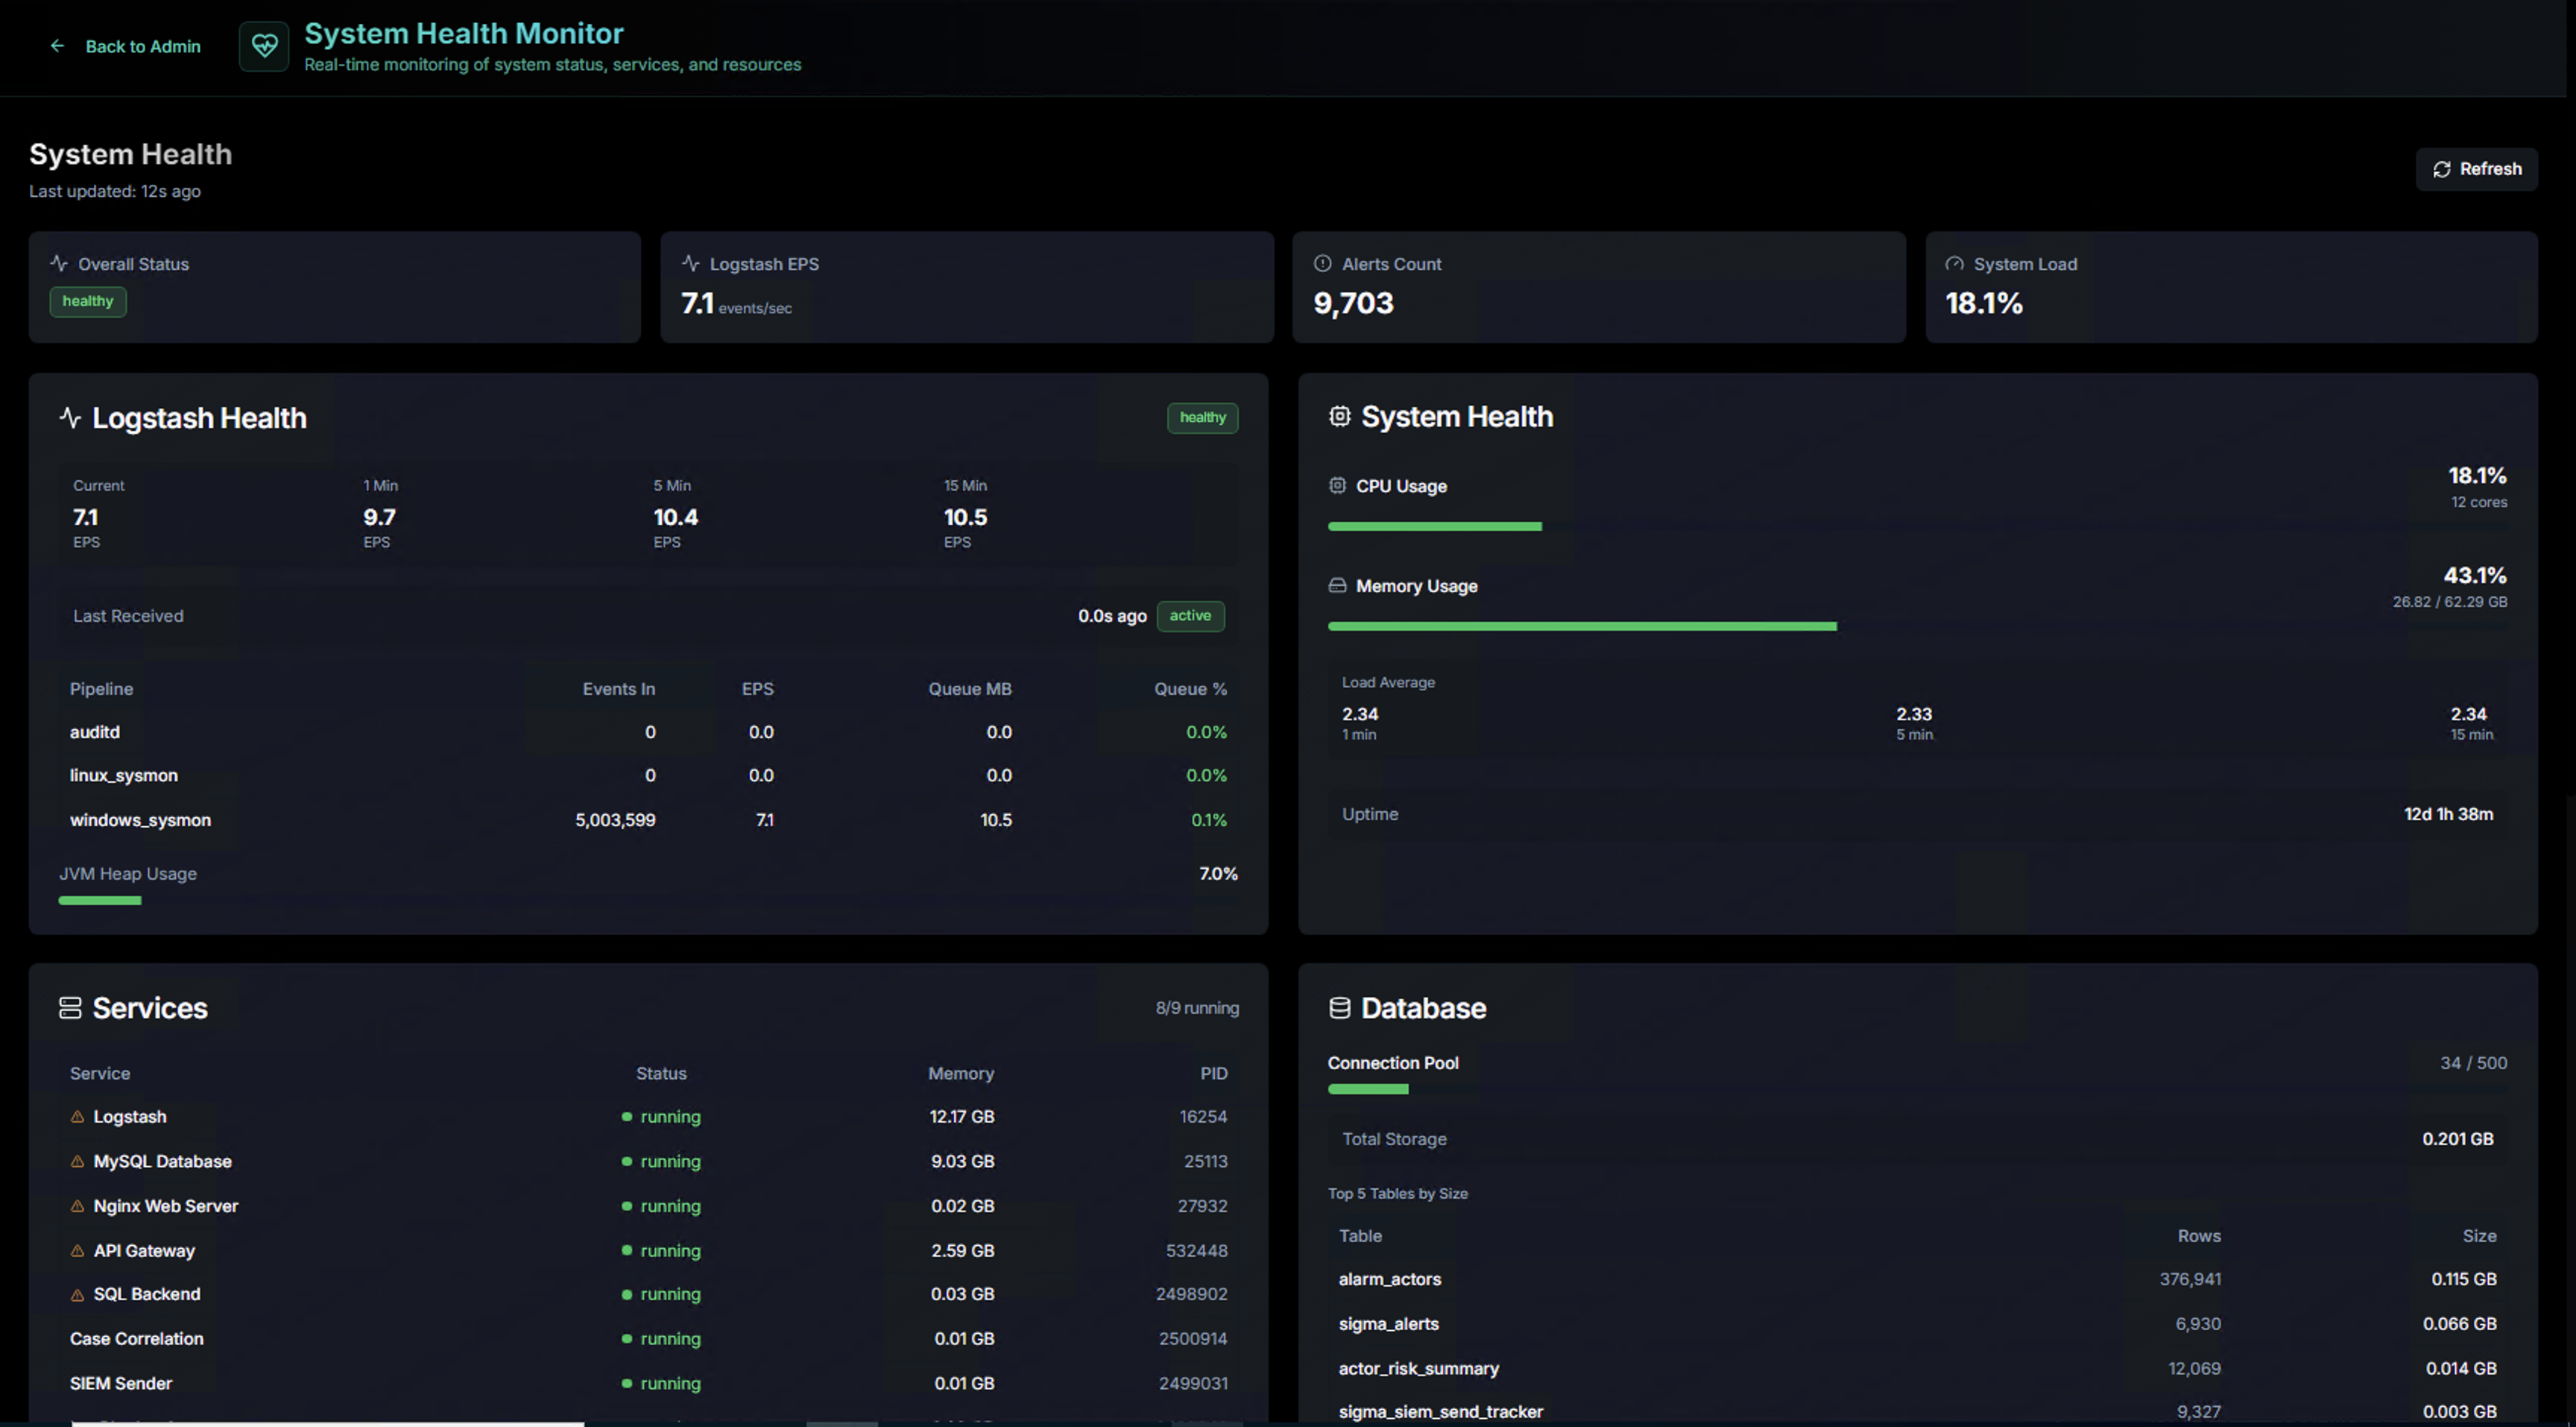
The top bar displays four key metrics at a glance:
| Metric | Description |
|---|---|
| Overall Status | Aggregate health indicator (Healthy = all services operational) |
| Detection EPS | Current events per second being processed by the detection pipelines |
| Alerts Count | Total number of alerts in the system |
| System Load | Current CPU and memory utilization as a percentage |
Pipeline Health
The Pipeline Health panel monitors the detection pipeline performance:
| Metric | Description |
|---|---|
| EPS (per pipeline) | Events per second for each active pipeline (Windows, Linux Sysmon, Linux Auditd) |
| Last Received | How recently each pipeline received log data — a stale timestamp indicates a log forwarding issue |
| Pipeline | Name of each active detection pipeline |
| Events In / Out | Total events ingested and processed per pipeline |
| Source IPs | Number of unique source IPs sending logs to each pipeline |
| Queue % | Pipeline queue utilization — sustained high values indicate the pipeline is falling behind |
A green Active badge next to each pipeline confirms it is running. If a pipeline shows as inactive, check the log source configuration and network connectivity.
System Health
The System Health panel shows real-time resource utilization:
| Metric | Description |
|---|---|
| CPU Usage | Current CPU utilization percentage with a usage bar |
| Memory Usage | Current RAM utilization with used/total values |
| Load Average | System load averages (1-min, 5-min, 15-min) — values above the CPU core count indicate saturation |
| Uptime | How long the system has been running since last reboot |
Services
The Services panel lists every RhythmX component and its current state:
| Column | Description |
|---|---|
| Service | Component name (e.g., Detection Engine, Database, Web Server, API Gateway, Case Correlation, Syslog Sender, LogRhythm Sync, FP Auto Detector) |
| Status | Running (green) or Stopped (red) |
| Memory | Current memory consumption per service |
| PID | Process ID for troubleshooting |
All services should show a green Running status. If any service is stopped, use the system administration tools to restart it.
Database
The Database panel monitors MySQL performance and storage:
| Metric | Description |
|---|---|
| Connection Pool | Active database connections out of the maximum pool size |
| Disk Storage | Total disk space used by the database |
| Top 5 Tables by Size | The largest database tables with row counts and disk size — useful for identifying tables that may need maintenance or archival |