MSSP Dashboard
The MSSP Dashboard is a multi-tenant security monitoring interface designed for Managed Security Service Providers. It provides an at-a-glance view of all monitored client entities, their risk posture, alert distribution, and MITRE ATT&CK coverage — enabling SOC teams to prioritize across multiple organizations from a single pane of glass.
Enabling the MSSP Dashboard
The MSSP Dashboard is controlled by a toggle in the Security Control Center header bar.
MSSP Toggle ON:

When enabled, the MSSP Dashboard tile appears in the Security Control Center grid with the label "Enterprise security posture and entity risk monitoring." Click View MSSP Analytics to open the dashboard.
MSSP Toggle OFF:
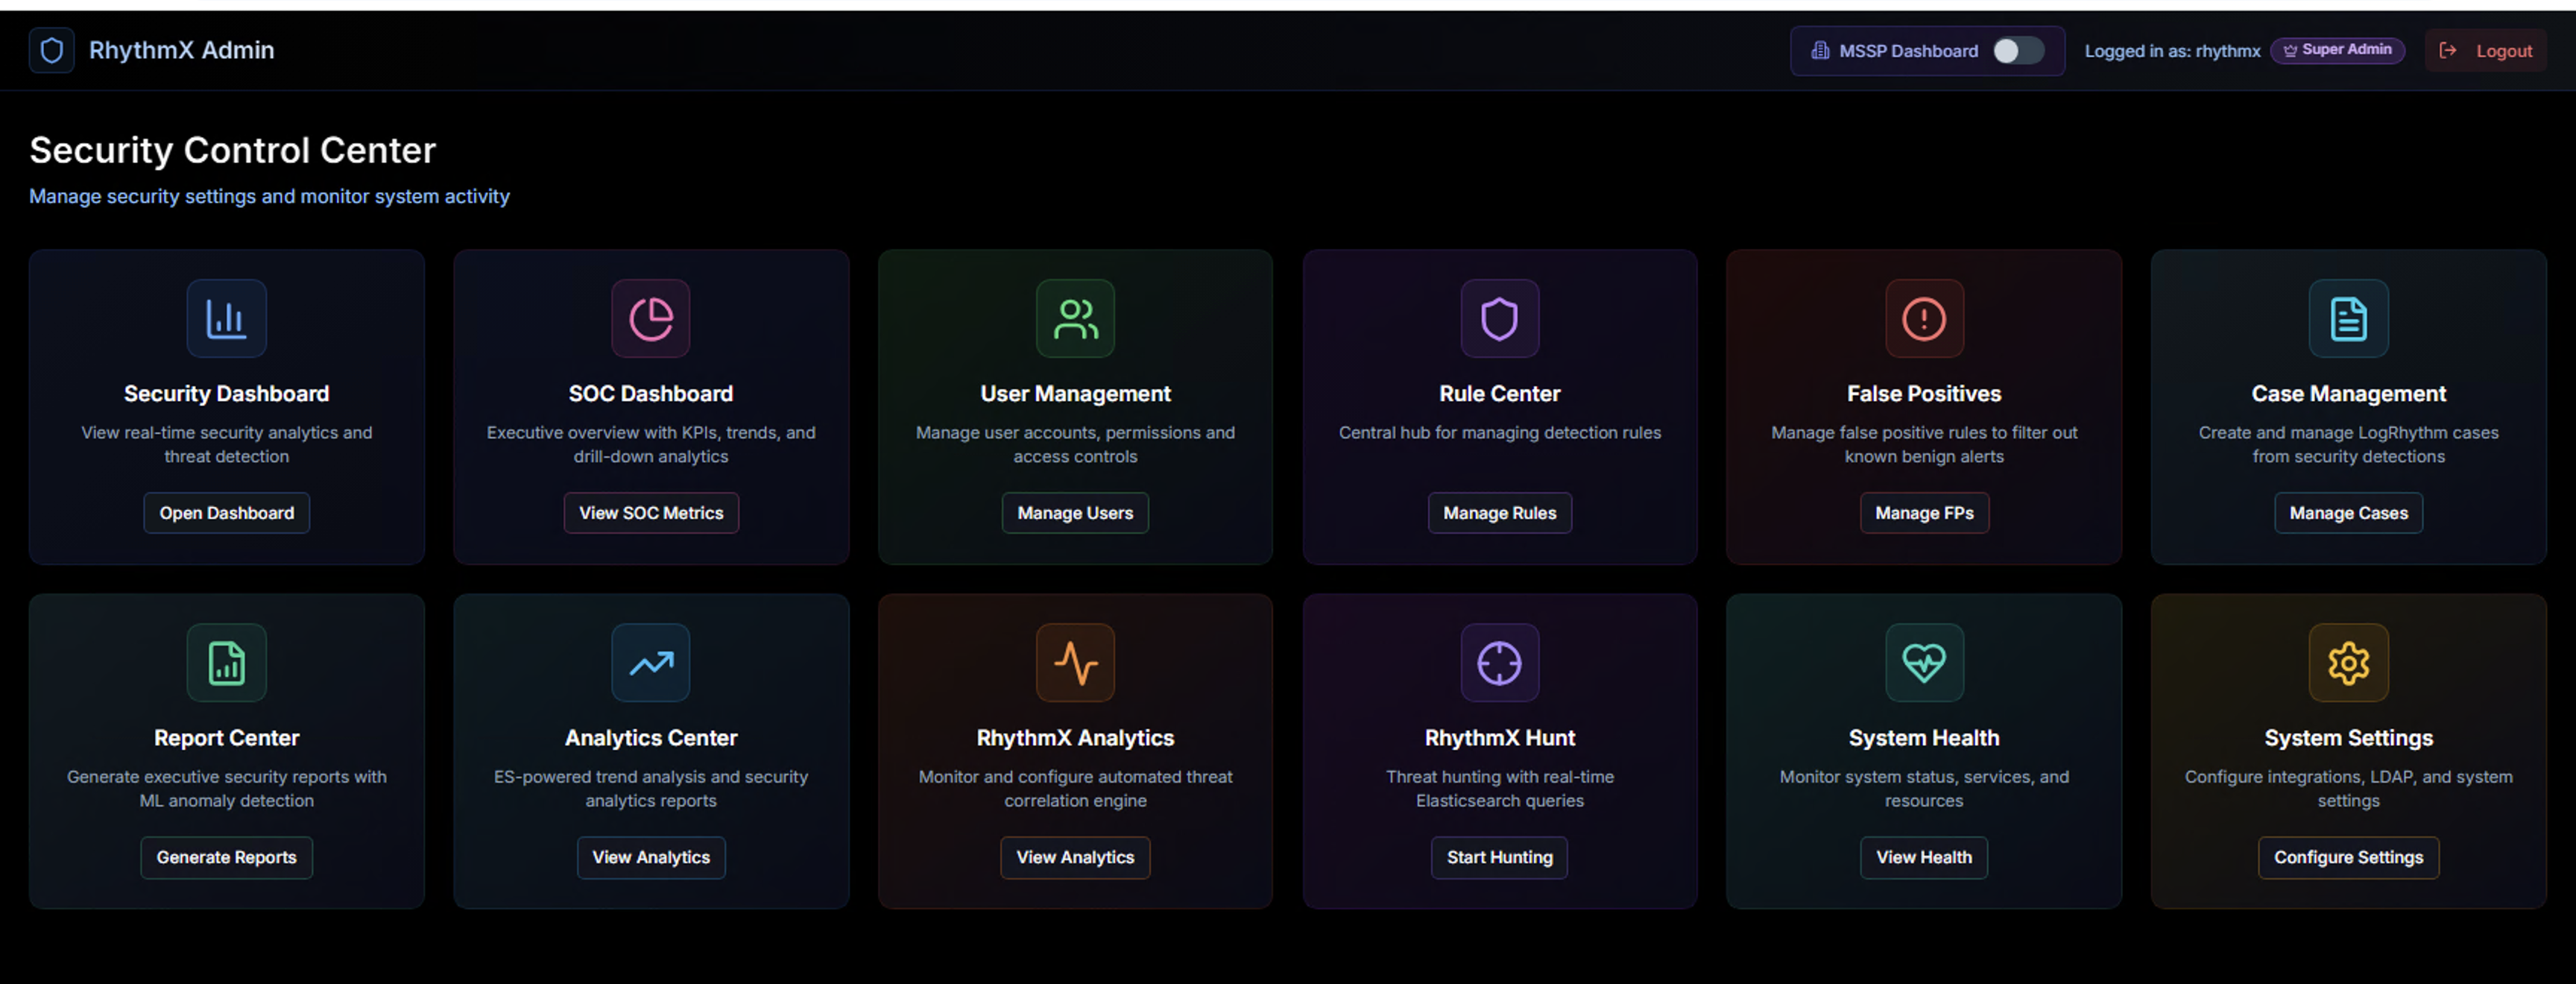
When disabled, the MSSP Dashboard tile is hidden from the Security Control Center. All other modules remain accessible.
Dashboard Overview
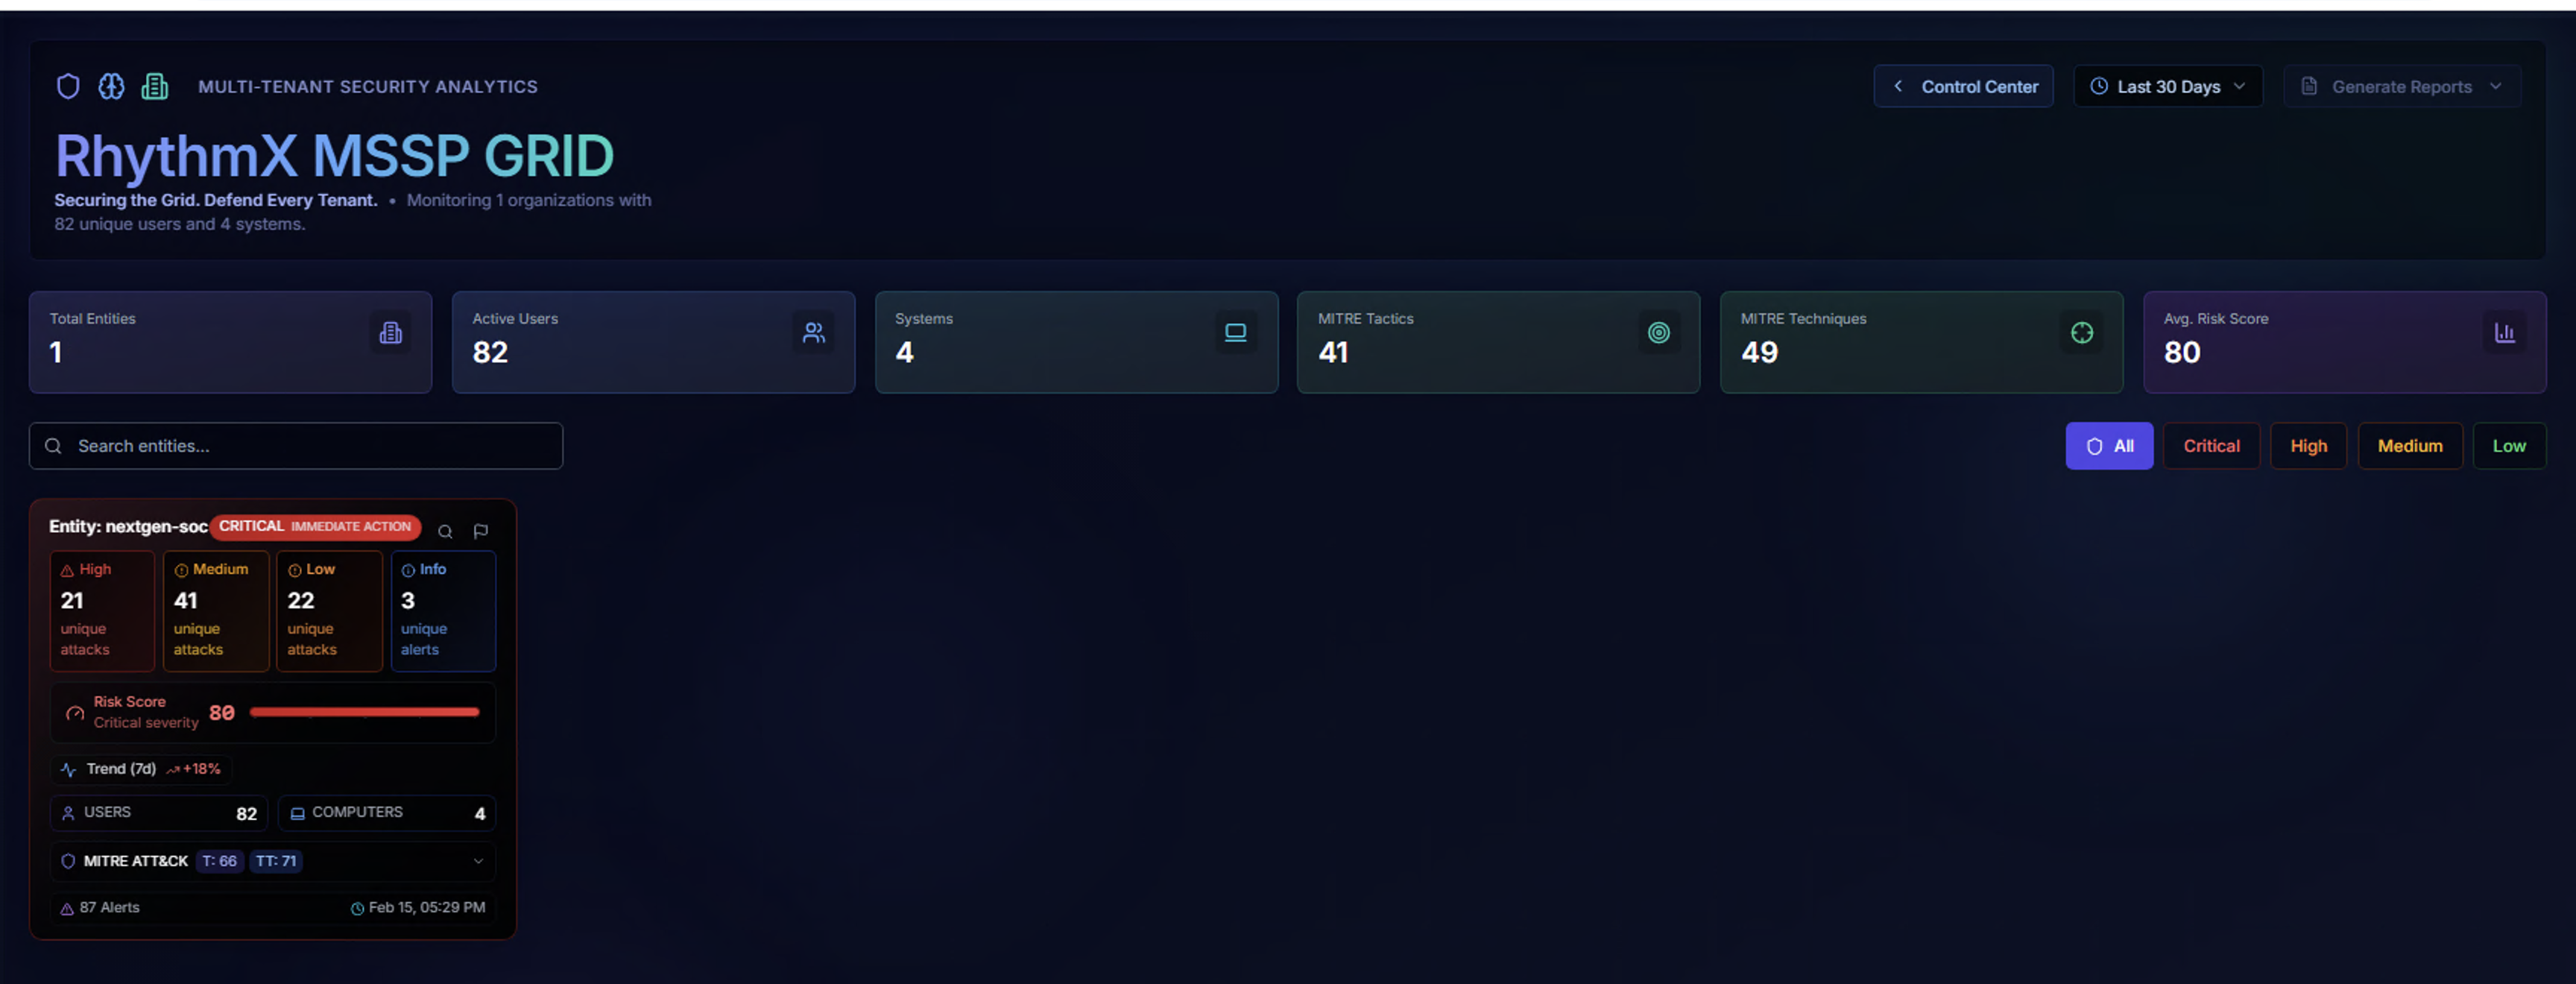
The MSSP Dashboard header displays:
- Title — "RhythmX MSSP GRID — Securing the Grid. Defend Every Tenant."
- Monitoring summary — Total organizations monitored, unique users, and systems
- Control Center link — Return to the Security Control Center
- Time Range selector — Choose the analysis period (e.g., Last 30 Days)
- Generate Reports — Export executive summary or detailed reports (7/14/30 day options)
KPI Cards
Six aggregate KPI cards display across the top:
| KPI | Description |
|---|---|
| Total Entities | Number of monitored client organizations |
| Active Users | Total unique user accounts across all entities |
| Systems | Total unique systems across all entities |
| MITRE Tactics | Total unique MITRE ATT&CK tactics detected |
| MITRE Techniques | Total unique MITRE ATT&CK techniques detected |
| Avg. Risk Score | Average risk score (0–100) across all entities |
Filtering Entities
Search
Use the Search entities bar to filter the entity grid by name.
Risk Tier Filter
Filter entities by risk level using the tier buttons:
| Tier | Score Range | Description |
|---|---|---|
| All | 0–100 | Show all entities |
| Critical | 76–100 | Immediate action required |
| High | 51–75 | Significant risk |
| Medium | 26–50 | Moderate concern |
| Low | 0–25 | Minimal risk |
Entity Risk Cards
Each monitored entity is displayed as a risk card showing its complete security posture:
Alert Distribution
Four color-coded indicators showing the count of unique alert types by severity:
| Indicator | Description |
|---|---|
| High | High-risk unique attack types |
| Medium | Medium-risk unique attack types |
| Low | Low-risk unique attack types |
| Info | Informational alerts |
Risk Score (0–100)
A visual risk meter displays the entity's calculated risk score on a 0–100 scale. The score is computed using a multi-factor model:
| Factor | Weight | What It Measures |
|---|---|---|
| MITRE ATT&CK Coverage | 40% | Diversity of attack tactics and techniques — more kill chain coverage indicates a more sophisticated threat |
| Base Risk | 25% | Cumulative severity of all alerts using logarithmic scaling |
| ML Anomaly Detection | 20% | Whether the ML engine flagged anomalous behavior patterns |
| Privilege Level | 10% | Whether privileged accounts are involved in the activity |
| Behavioral Volume | 10% | Volume of unique alert types — more diverse attacks score higher |
The score maps to risk tiers:
- 76–100 — Critical (Red)
- 51–75 — High (Orange)
- 26–50 — Medium (Yellow)
- 0–25 — Low (Green)
Activity Trend
Shows the 7-day trend as a percentage change. A rising trend (e.g., +18%) is displayed in red indicating increasing risk. A declining trend is displayed in green.
Entity Statistics
- Users — Total unique user accounts in the entity
- Computers — Total unique systems in the entity
MITRE ATT&CK Coverage
Expandable section showing:
- Tactics count — Number of distinct MITRE ATT&CK tactics detected (e.g., T:68)
- Techniques count — Number of distinct techniques detected (e.g., TT:71)
- Tactic and technique names displayed as color-coded badges when expanded
Card Footer
- Alert count — Total alerts for this entity
- Last seen — Timestamp of the most recent activity
- Investigate button — Opens the entity investigation view
- Mark as False Positive button — Flags the entity for review
Entity Drill-Down
Security Dashboard (Entity-Filtered)
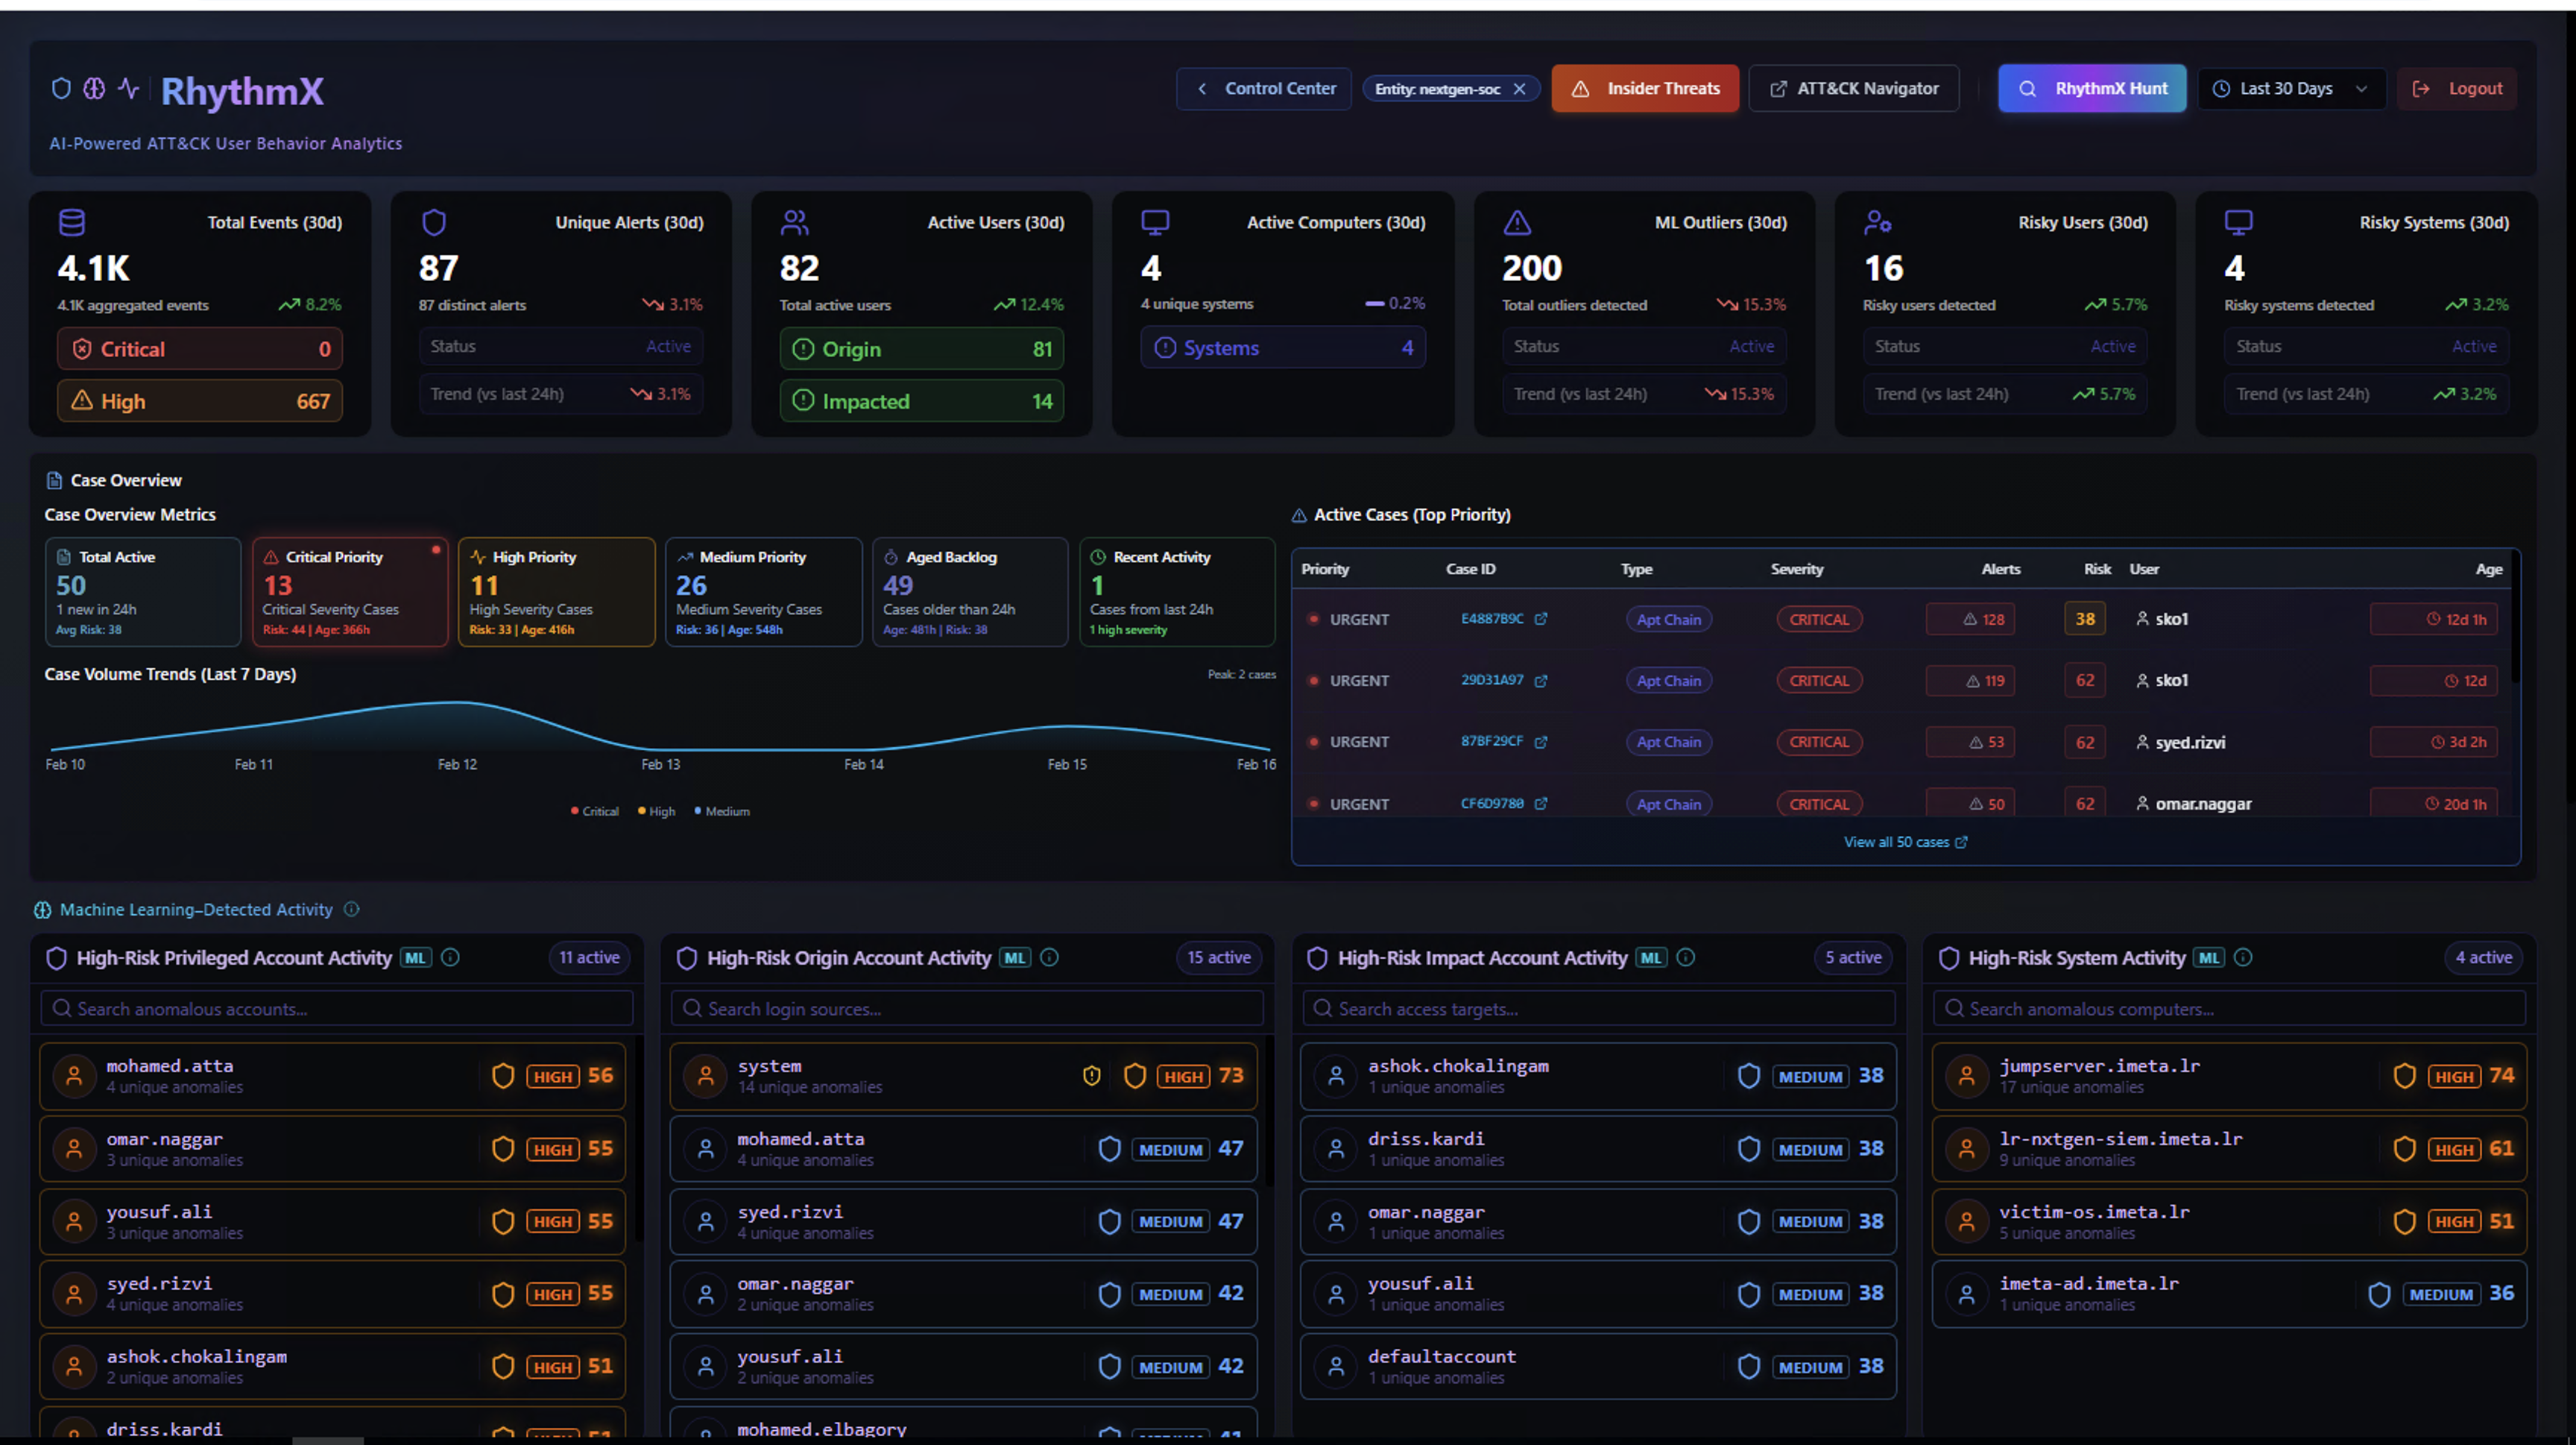
Click any entity card to navigate to the main Security Dashboard filtered to that specific entity. This provides the full analyst view scoped to a single client organization, including:
- Entity-scoped KPIs — Total events, unique alerts, active users, active computers, ML outliers, ML clusters, risky users, risky systems
- Case Overview — Case volume trend chart and active cases table for the entity
- High Risk Activity — Privileged account activity, origin account activity, impact account activity, and system activity panels
- ATTACK Navigator — MITRE ATT&CK heat map for the entity
- Baseline Threats — Threat baseline comparison
All dashboard modules automatically filter to the selected entity's data.
Case Management (Entity-Filtered)
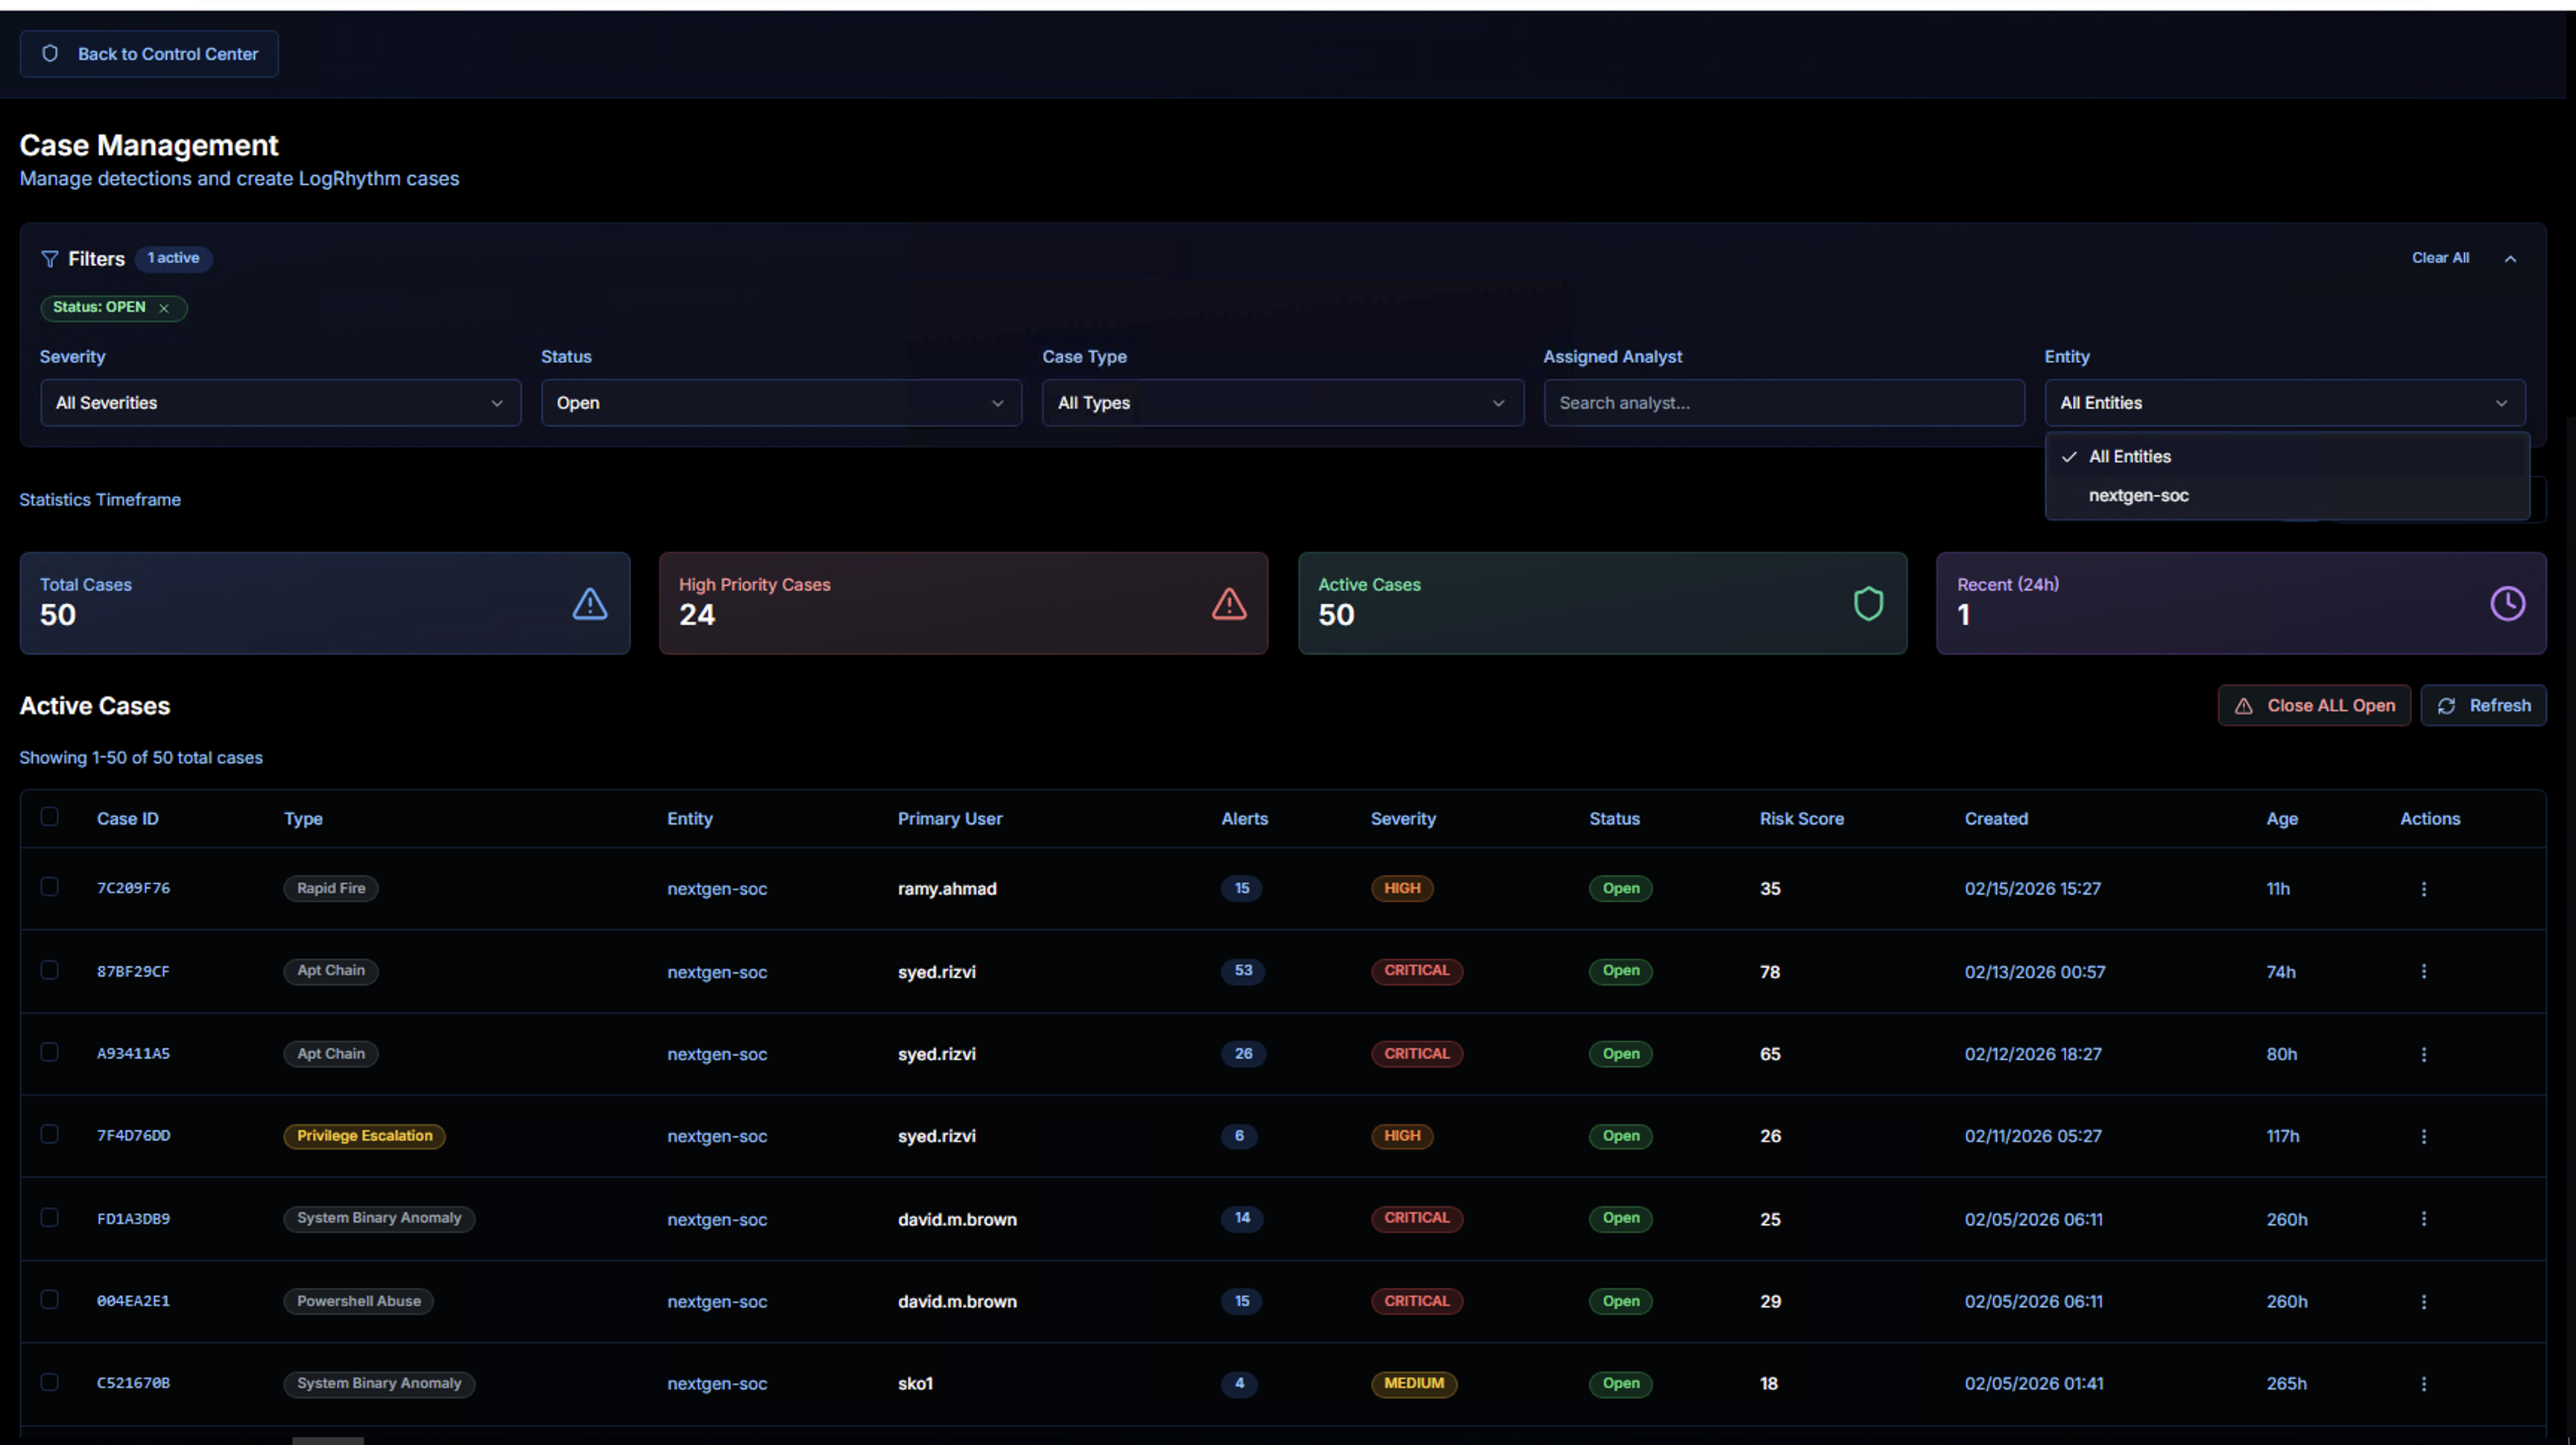
From the entity dashboard, navigate to Case Management to see cases filtered to the selected entity. The Entity filter dropdown lets you switch between:
- All Entities — View cases across all organizations
- Specific entity — View cases for a single client (e.g., nextgen-soc)
All case management features (filtering, KPIs, case detail, attack chain analysis, AI triage) work within the entity context.
Report Generation
The Generate Reports dropdown in the MSSP header provides two report types:
| Report Type | Options | Description |
|---|---|---|
| Executive Summary | 7 / 14 / 30 days | High-level overview for management — key metrics, risk trends, and recommendations |
| Detailed Report | 7 / 14 / 30 days | Comprehensive technical report with full alert details, MITRE mappings, and case analysis |
Reports can be generated for a specific entity or across all entities using the MSSP entity selector.
MSSP Workflow Summary
flowchart TD
    A[Security Control Center<br><b>MSSP Toggle ON</b>] --> B[MSSP Dashboard<br><b>Entity Grid Overview</b>]
    B --> C[Filter & Prioritize<br><b>Search, Risk Tier, Time Range</b>]
    C --> D[Entity Risk Card<br><b>Risk Score, Alerts, MITRE</b>]
    D --> E[Entity Drill-Down<br><b>Full Security Dashboard</b>]
    E --> F[Case Management<br><b>Entity-Filtered Cases</b>]
    E --> G[Investigation<br><b>Entity-Scoped Analysis</b>]
D --> H[Generate Reports<br><b>Executive / Detailed</b>]| Step | What the Analyst Does | Key Decision |
|---|---|---|
| 1. Review Grid | Scan all entity cards for risk levels and trends | Which entity needs attention first? |
| 2. Filter | Narrow by risk tier, search by name, adjust time range | Focus on critical entities |
| 3. Assess Risk | Review risk score, alert distribution, MITRE coverage | How severe is the threat? |
| 4. Drill Down | Click entity card to view full security dashboard | What's happening in this entity? |
| 5. Investigate Cases | Review and manage cases scoped to the entity | What actions are needed? |
| 6. Report | Generate executive or detailed reports for stakeholders | How do we communicate the risk? |