RhythmX Investigator
RhythmX Investigator is the signal-driven, alert-centric investigation interface. While RhythmX Hunt searches raw logs, the Investigator focuses specifically on detection alerts — providing a targeted view of all behavioral detections associated with a user, computer, IP address, or process.
Access RhythmX Investigator from the top navigation bar by clicking RhythmX Investigator, or from within the Hunt interface.
Search
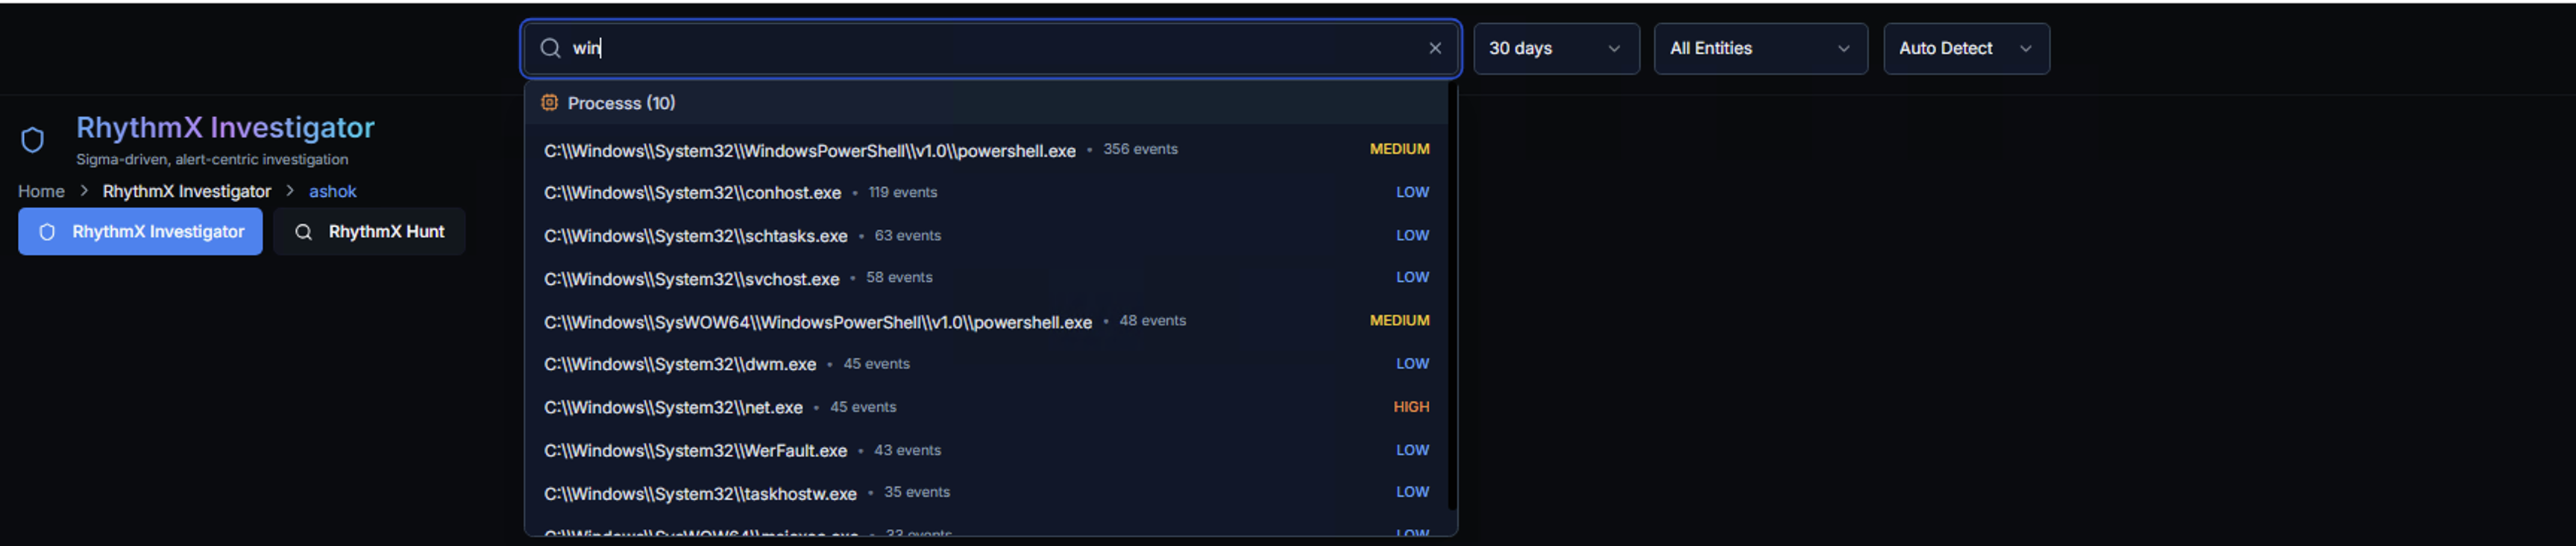
The search bar supports searching for users, computers, IPs, and processes. As you type, the Investigator provides contextual autocomplete with:
- Matching results grouped by type (e.g., Processes)
- Event count per match (e.g., 356 events)
- Risk level badge per match (LOW, MEDIUM, HIGH)
The search auto-detects the type of entity you're looking for:
| Input Pattern | Detected As | Example |
|---|---|---|
| IP address format | IP | 192.168.1.50 |
| Windows/Unix path | Process | C:\Windows\System32\net.exe |
| FQDN with domain | Computer | jumpserver.imeta.lr |
| Plain username | User | ramy.ahmad |
| Hex string (32-64 chars) | Hash | a1b2c3d4... |
| 1-5 digit number | Event ID | 4625 |
| Ambiguous text | General | Searches across all field types |
Filters
| Filter | Options |
|---|---|
| Time Range | 7 days, 30 days, and other presets |
| Entity | All Entities or a specific LogRhythm entity |
| Detection Mode | Auto Detect (default) — automatically determines the best search strategy |
Investigation Overview
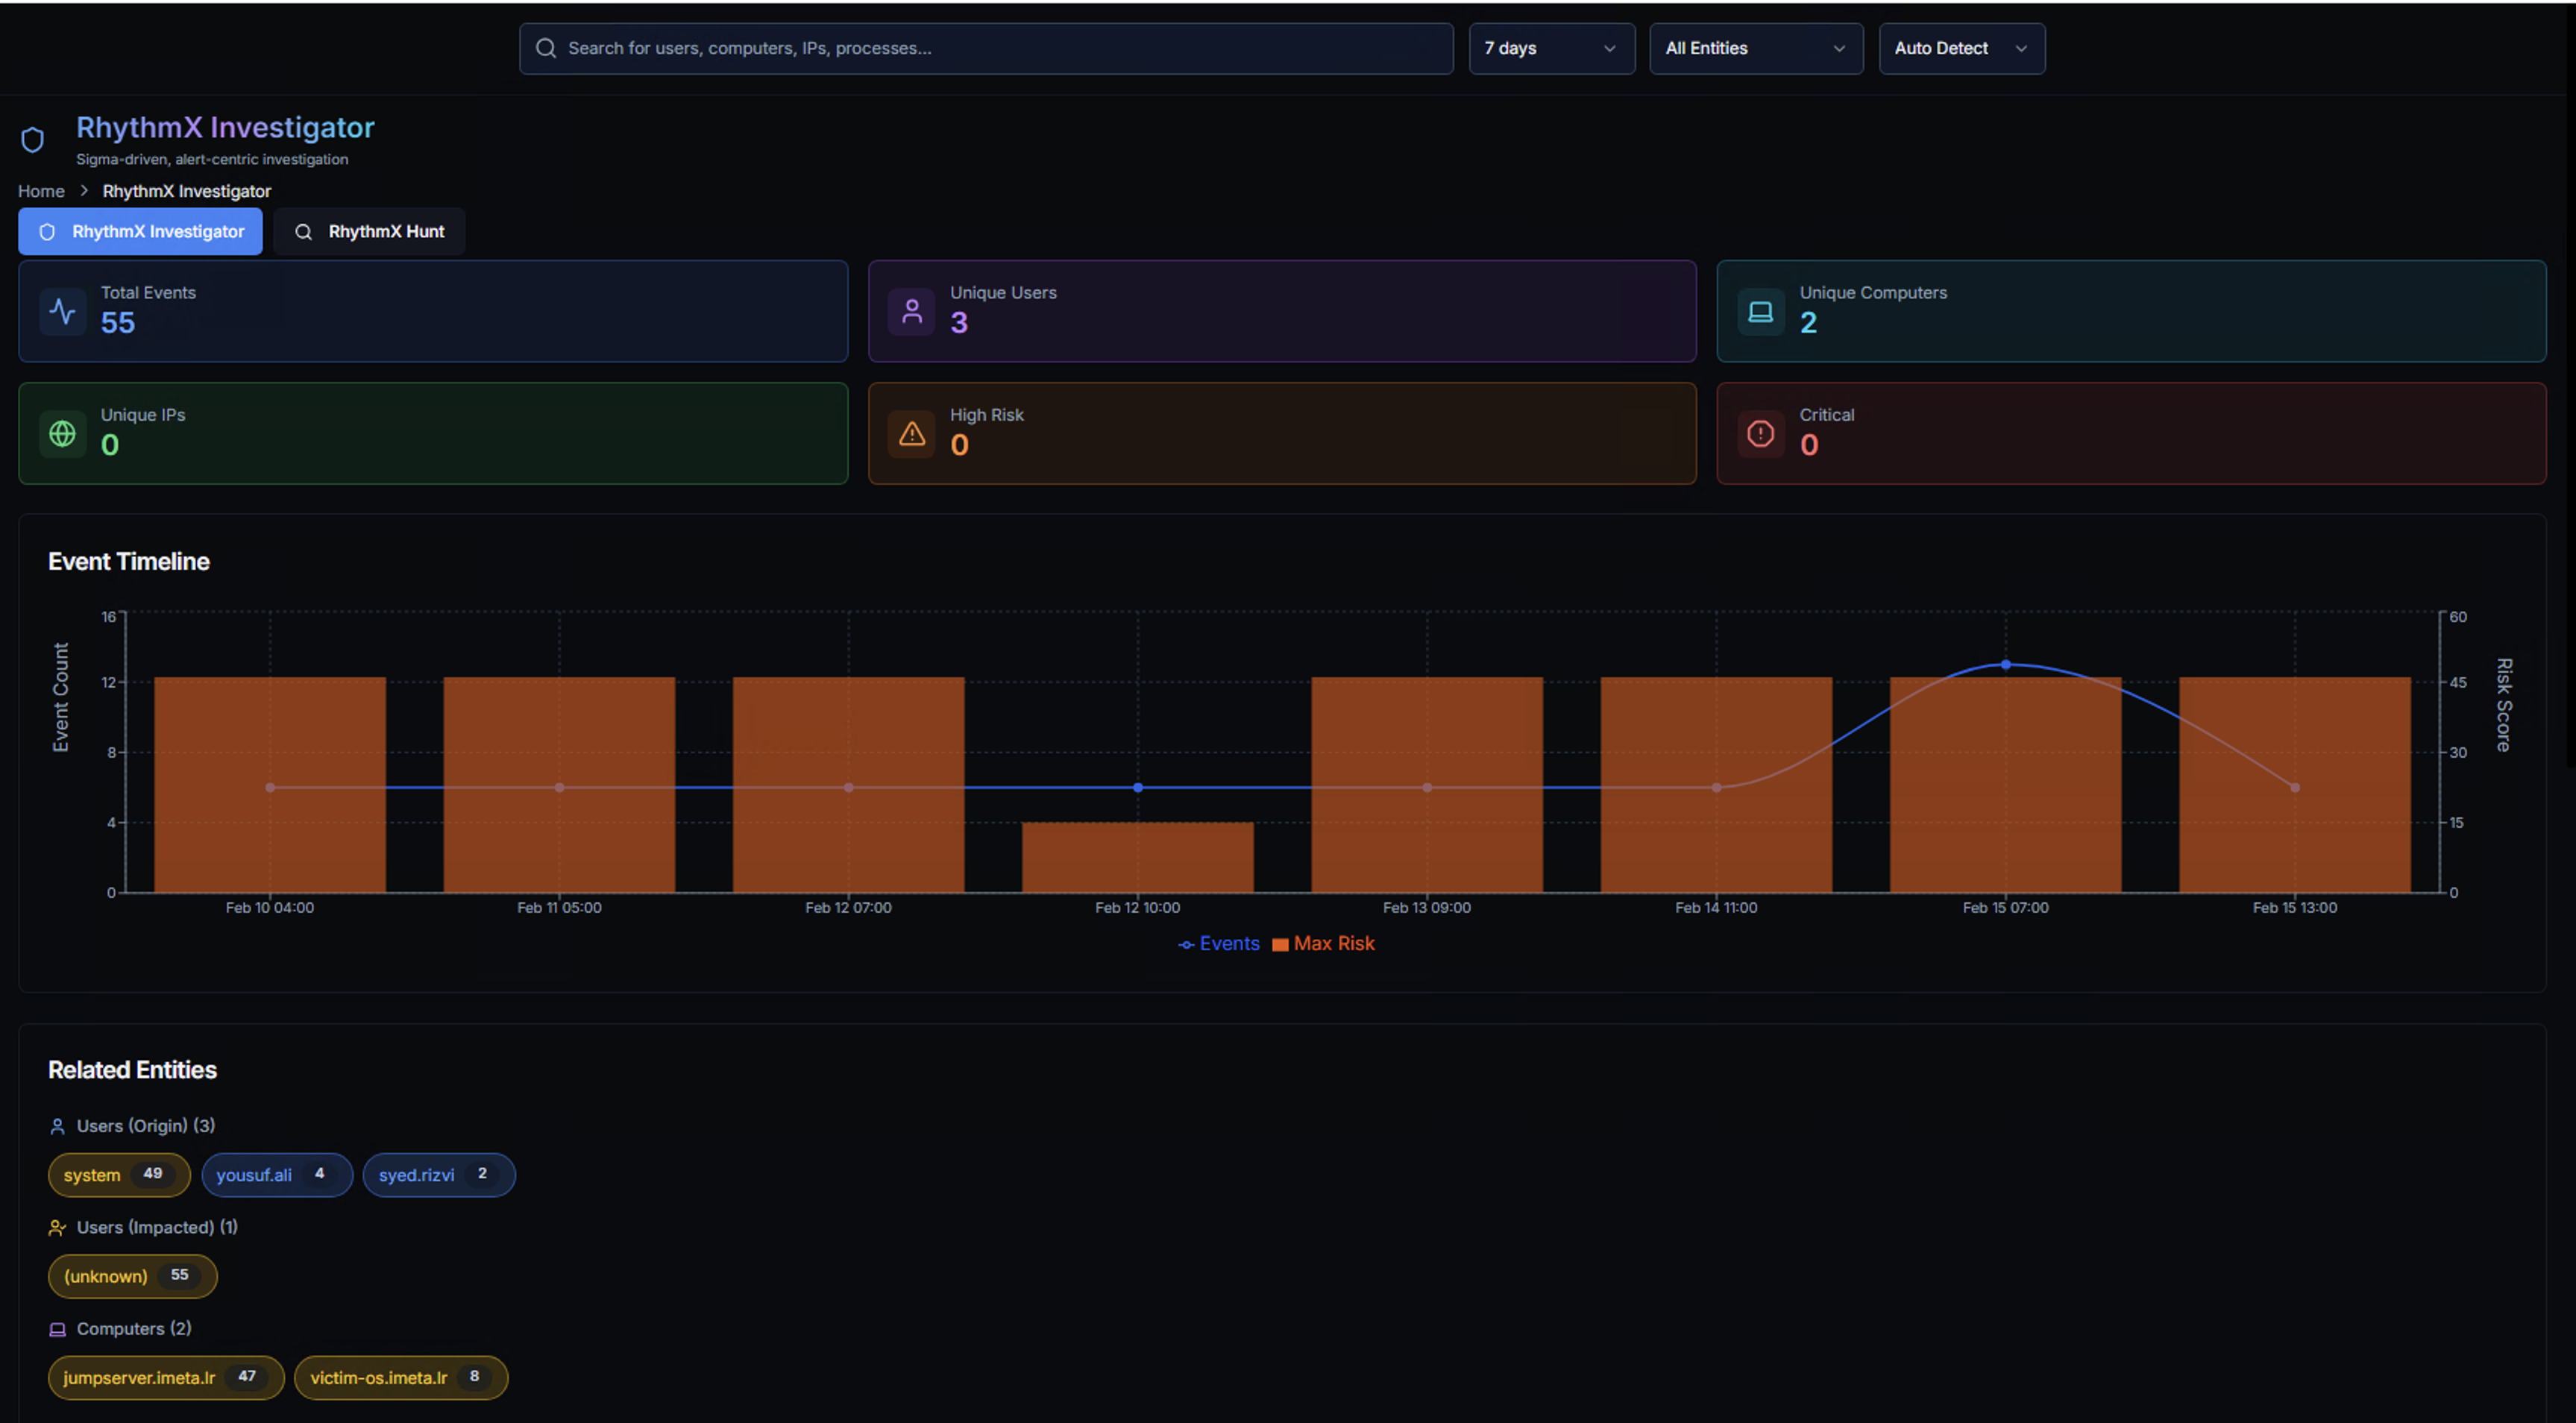
After searching, the Investigator displays a comprehensive overview of all detections for the searched entity.
KPIs
| KPI | Description |
|---|---|
| Total Events | Total detection events matching the search |
| Unique Users | Distinct user accounts involved |
| Unique Computers | Distinct systems involved |
| Unique IPs | Distinct IP addresses involved |
| High-Risk | Events classified as high risk |
| Critical | Events classified as critical risk |
Event Timeline
An area chart showing detection volume over time with two overlaid metrics:
- Orange bars — Event count per time period
- Blue line — Maximum risk score trend
This visualization reveals when activity spiked and whether the risk level increased with volume — a key indicator of escalating attack behavior versus steady-state noise.
Related Entities
The Related Entities section shows all identities connected to the searched entity:
| Category | What It Shows |
|---|---|
| Users (Origin) | User accounts that initiated the detected activity — each with event count badges |
| Users (Impacted) | User accounts that were targeted by the activity |
| Computers | Systems where the detections occurred — each with event count badges |
Click any related entity badge to pivot the investigation to that user, computer, or IP.
Alert Table
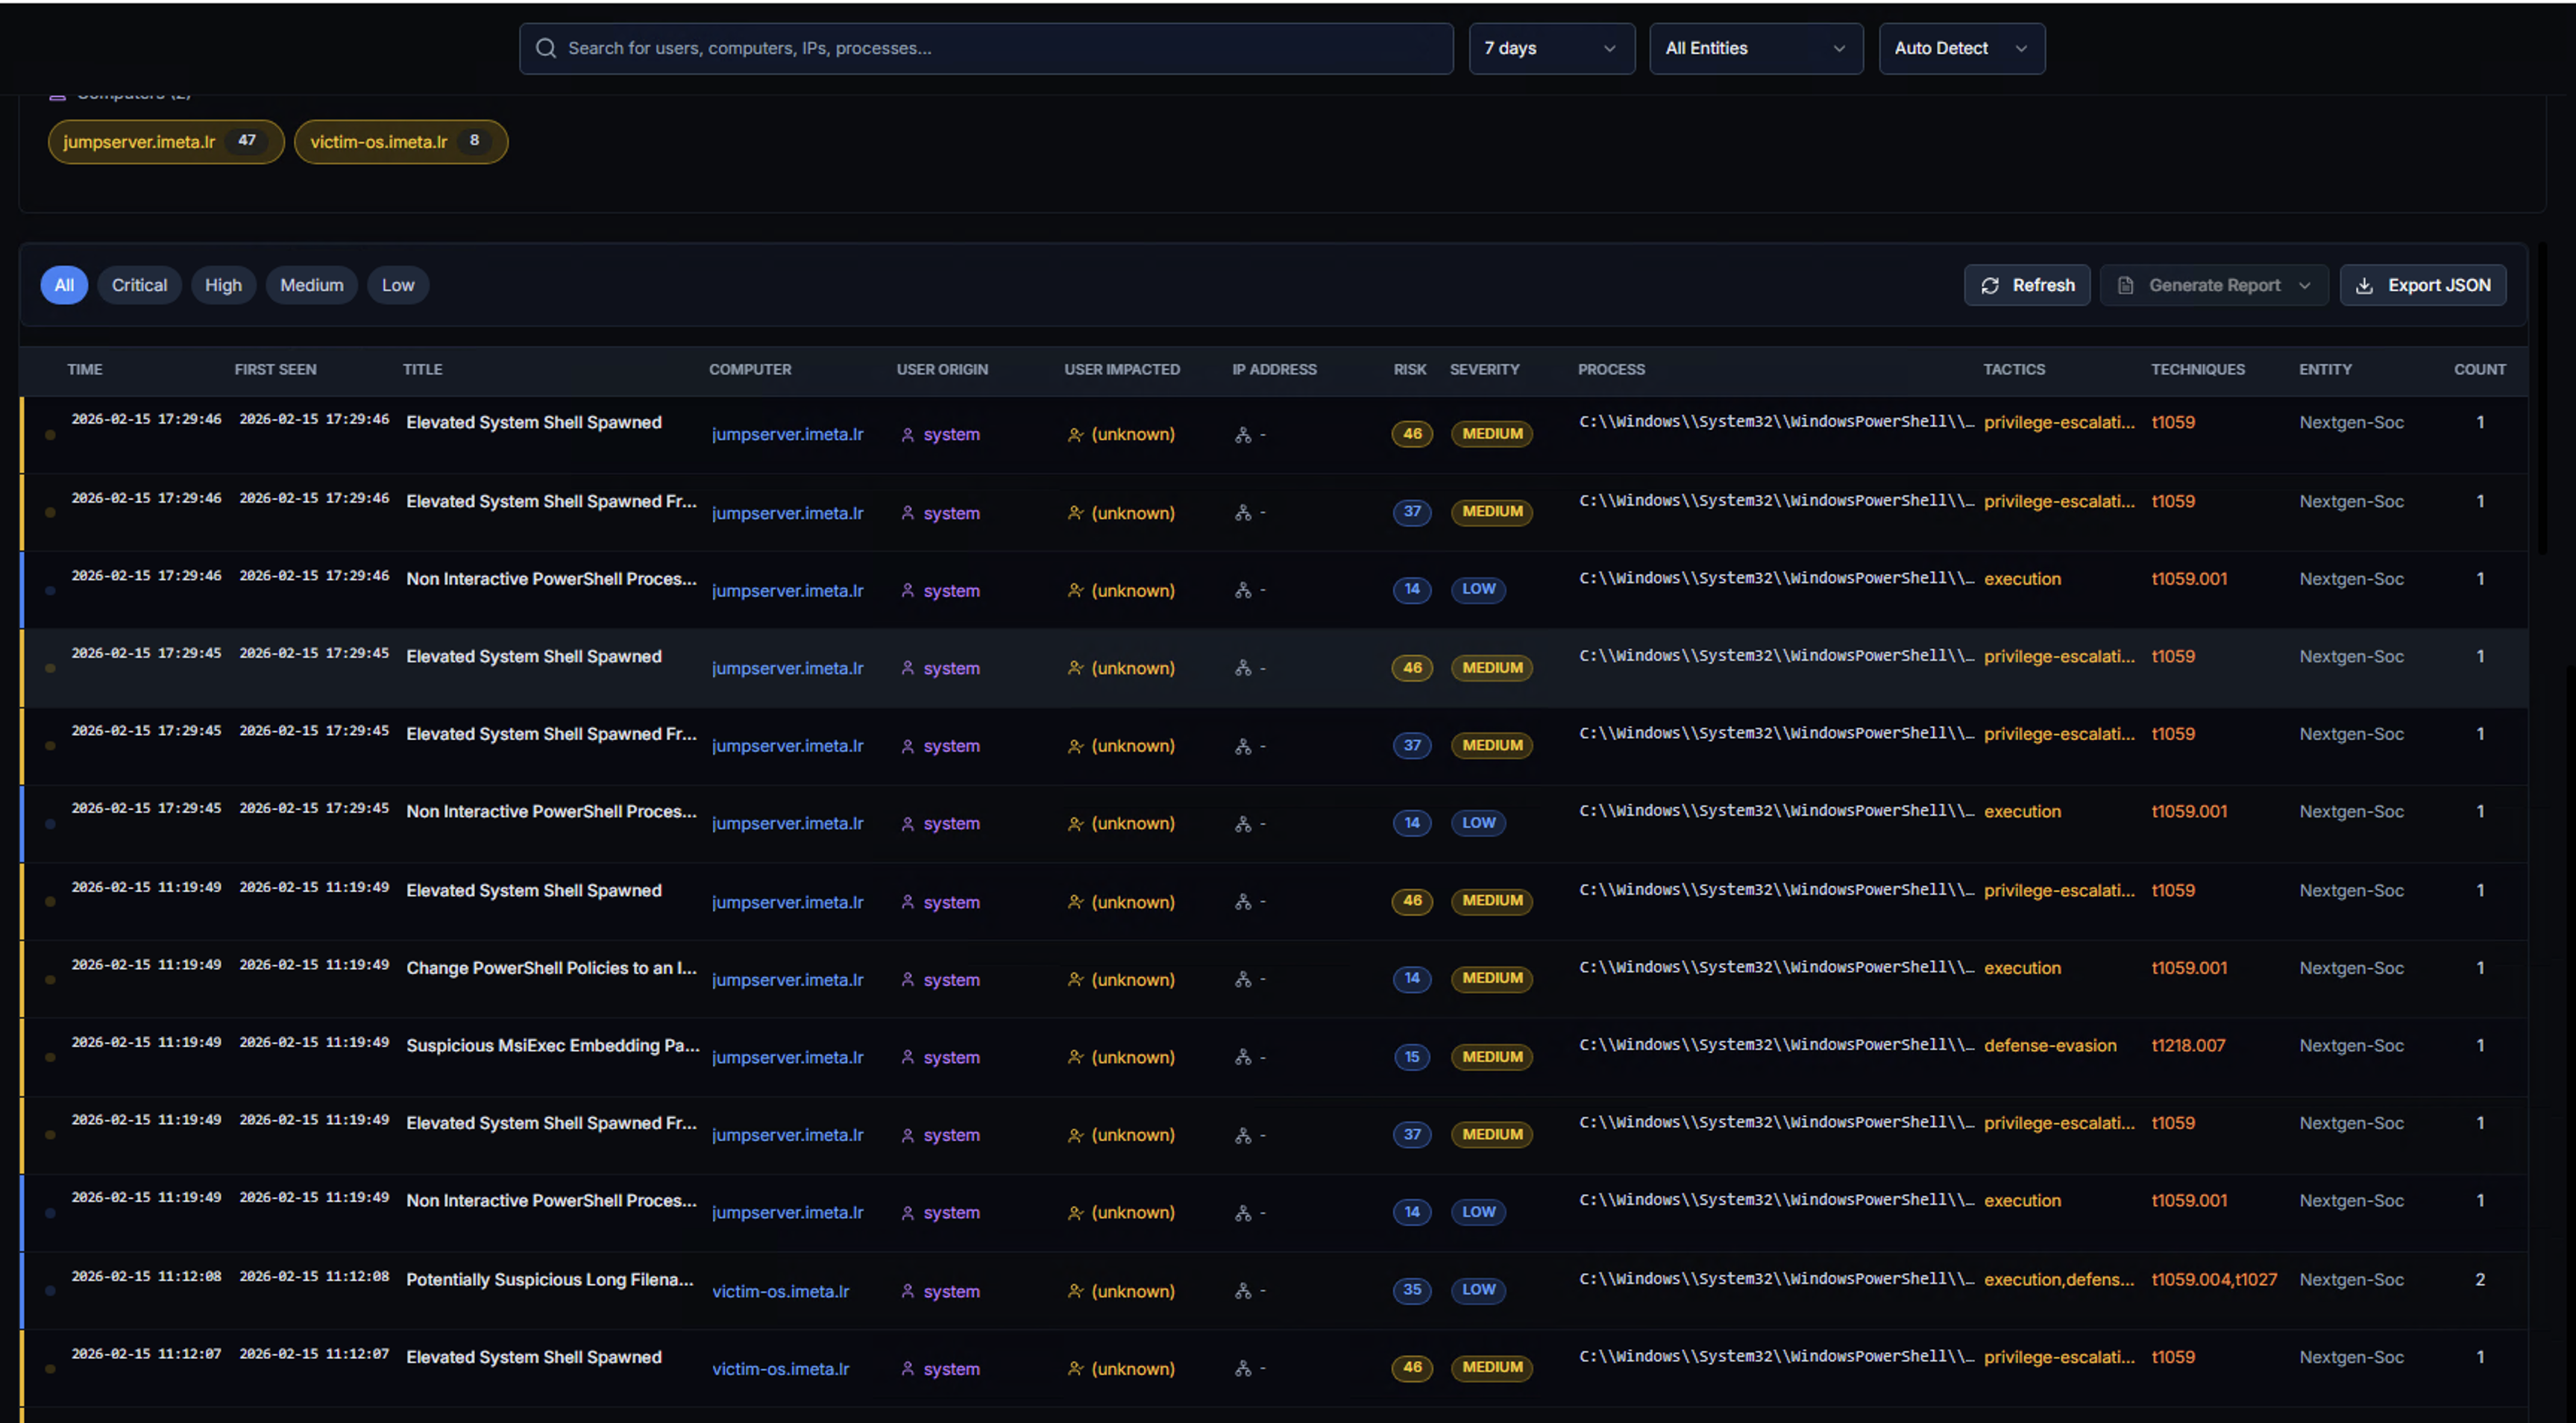
The alert table shows every detection event in detail. Filter by severity using the buttons at the top: Critical, High, Medium, Low.
Columns
| Column | Description |
|---|---|
| TIME | Event timestamp |
| FIRST SEEN | When this alert type was first observed for this entity |
| RULE | The Sigma detection rule that triggered |
| COMPUTER | System where the event occurred |
| USER ORIGIN | User account that performed the action |
| USER IMPACTED | User account that was targeted |
| IP ADDRESS | Associated IP address |
| SUBJECT | Subject account or object |
| PROCESS | Process path involved in the detection |
| TACTICS | MITRE ATT&CK tactics (e.g., privilege-escalation, defense-evasion) |
| ENTITY | LogRhythm entity |
Actions
- Refresh — Reload the alert data
- Generate Report — Export the investigation findings as a report
- Export JSON — Download the raw alert data in JSON format
Active filters appear as chips below the search bar (e.g., computer:jumpserver.imeta.lr, victim-os.imeta.lr). Click any chip to remove the filter.
Raw Log Data
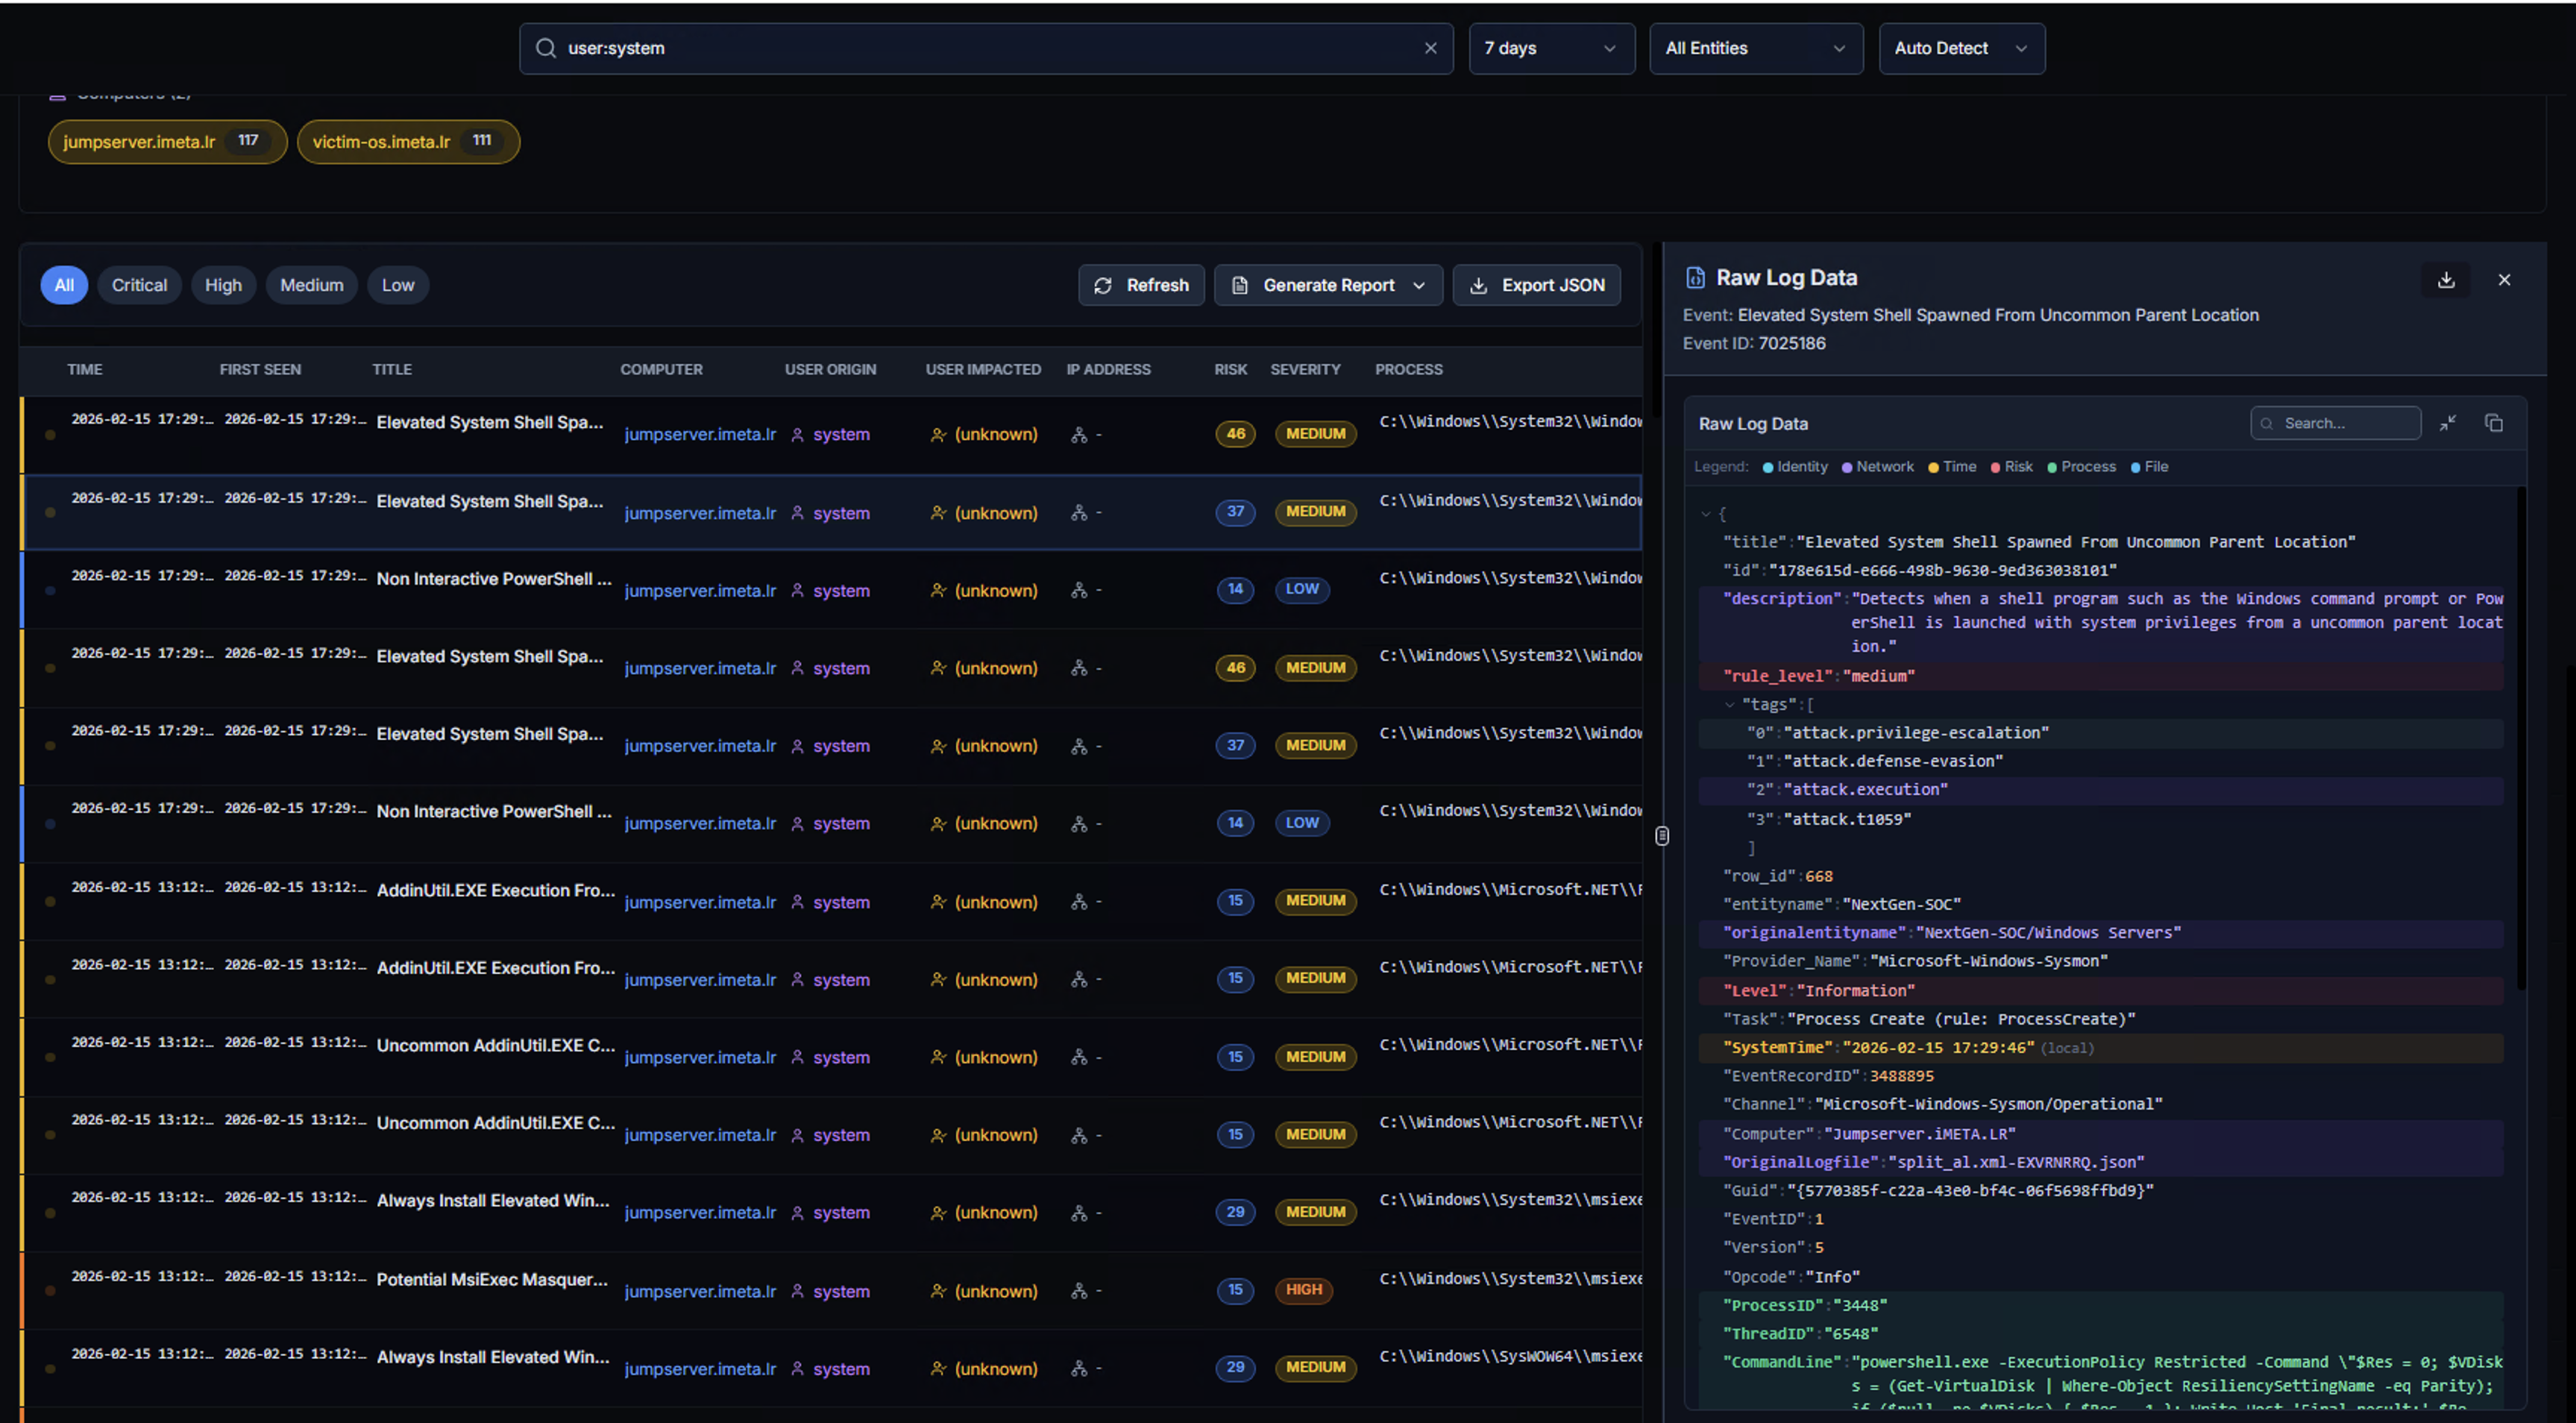
Click any alert row to open the Raw Log Data panel on the right side. This shows:
- Event title — The Sigma rule that triggered (e.g., "Elevated System Shell Spawned From Uncommon Parent Location")
- Event ID — Unique event identifier
- Raw Log Data — Complete JSON payload containing:
- Detection metadata (title, rule level, detection tags)
- Process information (parent process, command line, image path)
- MITRE ATT&CK mappings (tactics, techniques)
- System context (computer name, user, timestamps)
- Full event fields for forensic analysis
Use the search, copy, and expand buttons to work with the raw data.
Investigation Workflow
flowchart TD
    A[Alert or Alarm Triggers<br><b>Detection Event</b>] --> B[RhythmX Investigator<br><b>Search by User/Computer/IP/Process</b>]
    B --> C[Overview<br><b>KPIs, Timeline, Related Entities</b>]
    C --> D[Alert Table<br><b>Filter by Severity</b>]
    D --> E[Raw Log Data<br><b>Full Event Detail</b>]
    C --> F[Pivot<br><b>Click Related Entity</b>]
    F --> B
    D --> G[Generate Report<br><b>Export Findings</b>]
D --> H[Export JSON<br><b>Raw Data Download</b>]| Step | What the Analyst Does | Key Decision |
|---|---|---|
| 1. Search | Enter a user, computer, IP, or process to investigate | What entity triggered the alert? |
| 2. Review Overview | Check KPIs, timeline shape, and risk trend | Is this a spike or steady noise? |
| 3. Check Related Entities | See which users, computers, and IPs are connected | Is this activity isolated or spreading? |
| 4. Filter Alerts | Narrow by severity to focus on high/critical detections | Which alerts matter most? |
| 5. Examine Raw Logs | Read the full event data and MITRE mappings | What exactly happened? |
| 6. Pivot | Click a related entity to follow the investigation trail | Where did the attacker go next? |
| 7. Report | Generate a report or export JSON for documentation | How do we capture the findings? |