Investigation & Drill-Down
When a high-risk entity is identified on the Security Dashboard, analysts drill into it to investigate the full scope of activity. This page walks through the complete investigation workflow — from clicking a flagged entity to generating an AI-powered threat analysis report.
Starting an Investigation
Investigations begin from the Machine Learning Detected Activity section on the Security Dashboard.
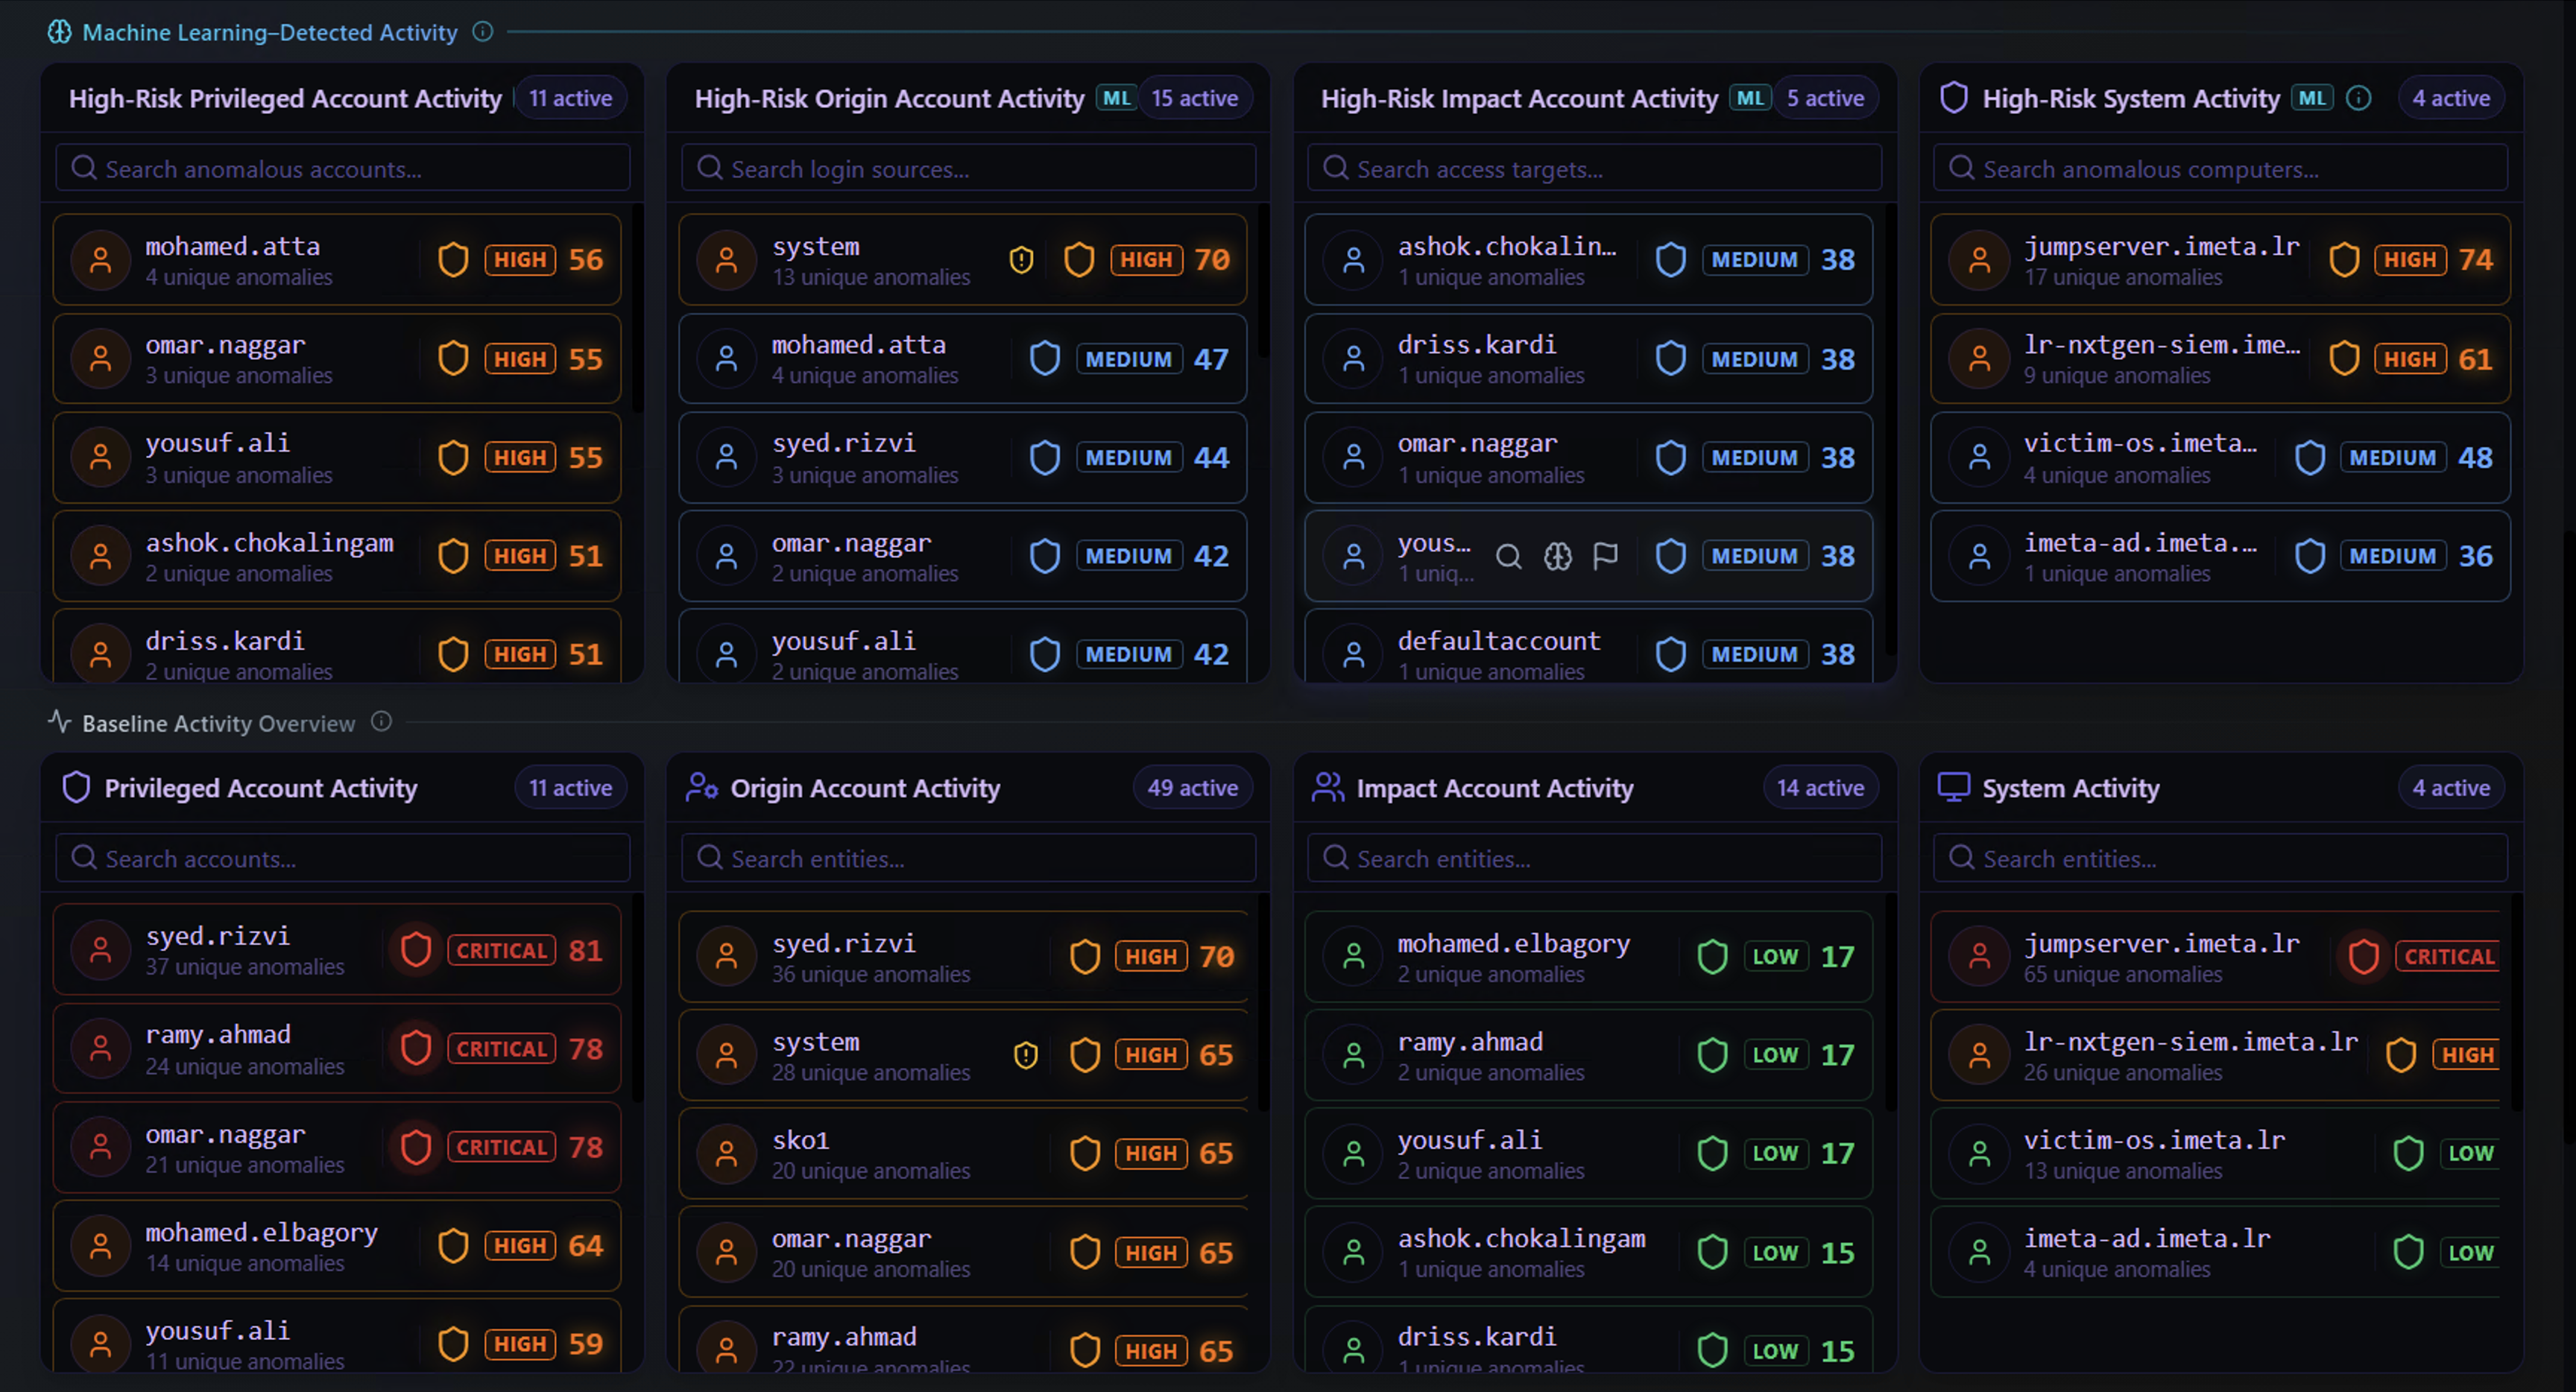
The top row contains four ML-Detected (High-Risk) panels. Each panel lists entities where the ML engine has flagged anomalous behavior:
| Panel | Click Here To Investigate |
|---|---|
| High-Risk Privileged Account Activity | A privileged account behaving abnormally — highest risk entities |
| High-Risk Origin Account Activity | A source account generating unusual alert patterns |
| High-Risk Impact Account Activity | An account being targeted by anomalous activity |
| High-Risk System Activity | A system exhibiting behavior outside its normal baseline |
Each entity row shows the username or system name, the severity level, and the number of unique anomalies. Click on any entity row to open the Security Timeline Analysis view for that entity.
Example: In the screenshot above, clicking jumpserver.imeta.ir (3 unique anomalies, HIGH) under High-Risk System Activity opens the full investigation timeline for that system.
Security Timeline Analysis
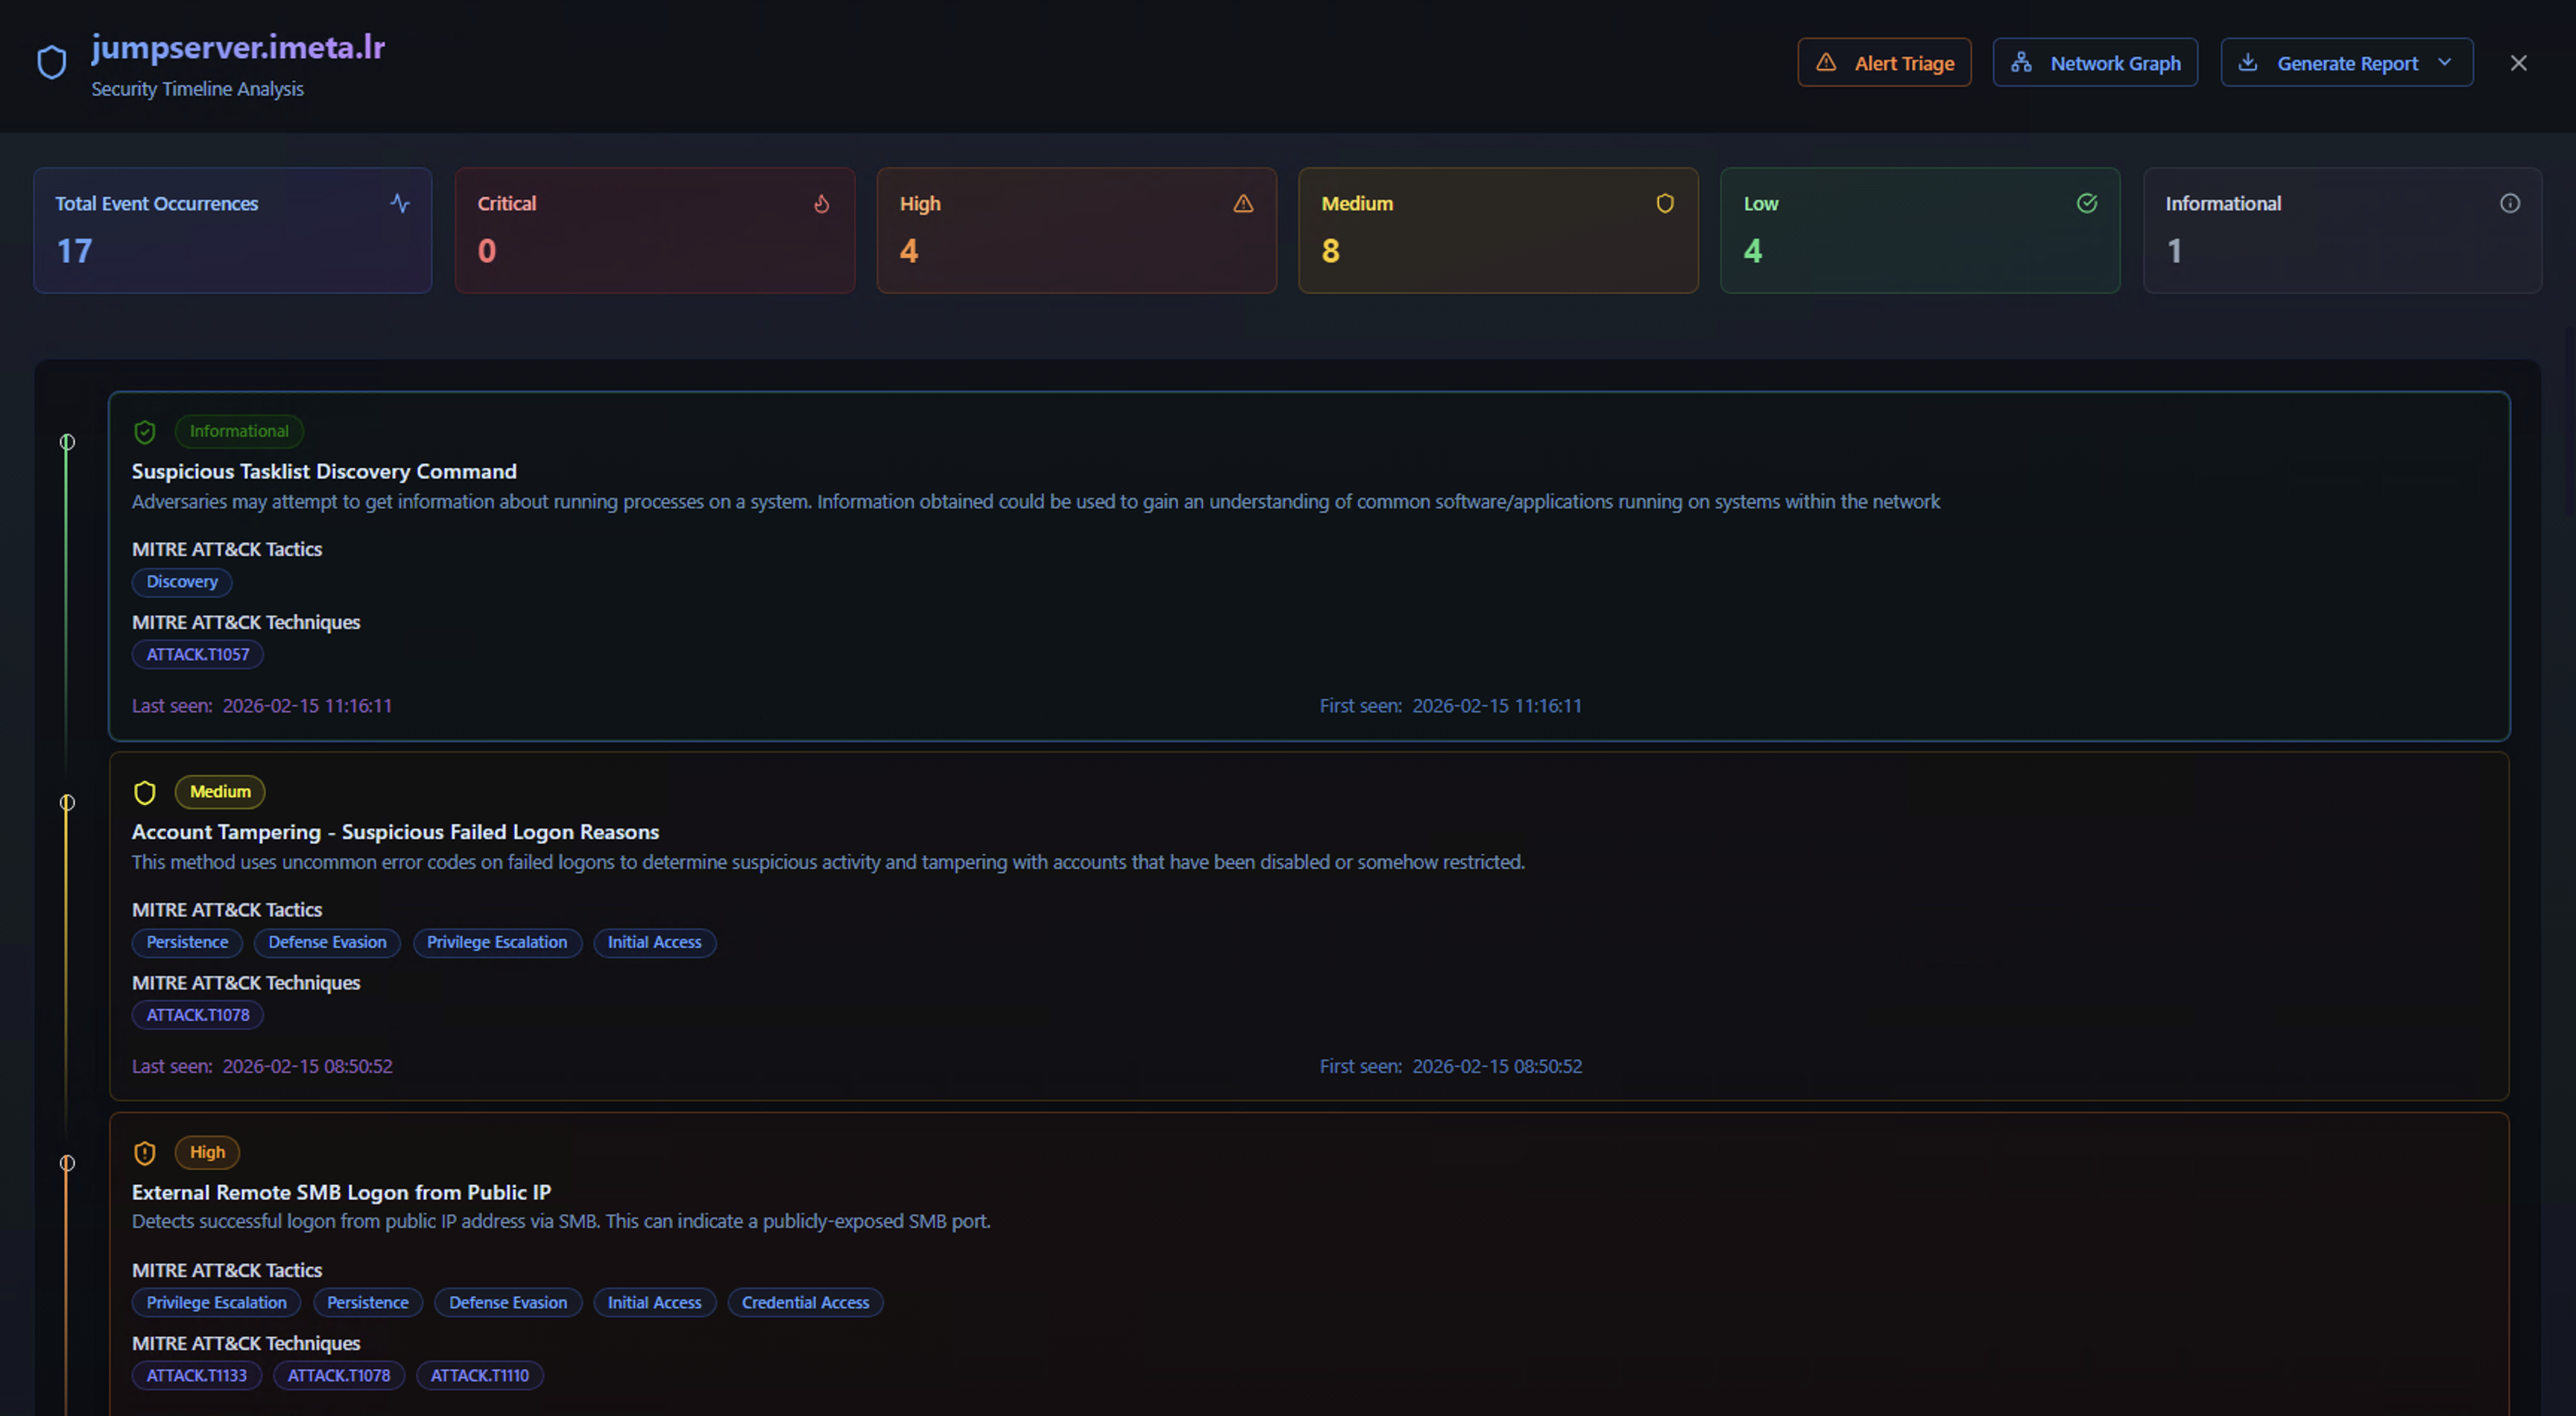
The timeline view is the primary investigation workspace. It shows all detection activity for the selected entity within the chosen time range.
Entity KPIs
The top bar provides an at-a-glance severity breakdown for the entity:
| Metric | Description |
|---|---|
| Total Event Occurrences | Total number of alert events for this entity |
| Critical | Events from critical-severity Sigma rules |
| High | Events from high-severity Sigma rules |
| Medium | Events from medium-severity Sigma rules |
| Low | Events from low-severity Sigma rules |
| Informational | Events from informational-severity Sigma rules |
Alert Cards
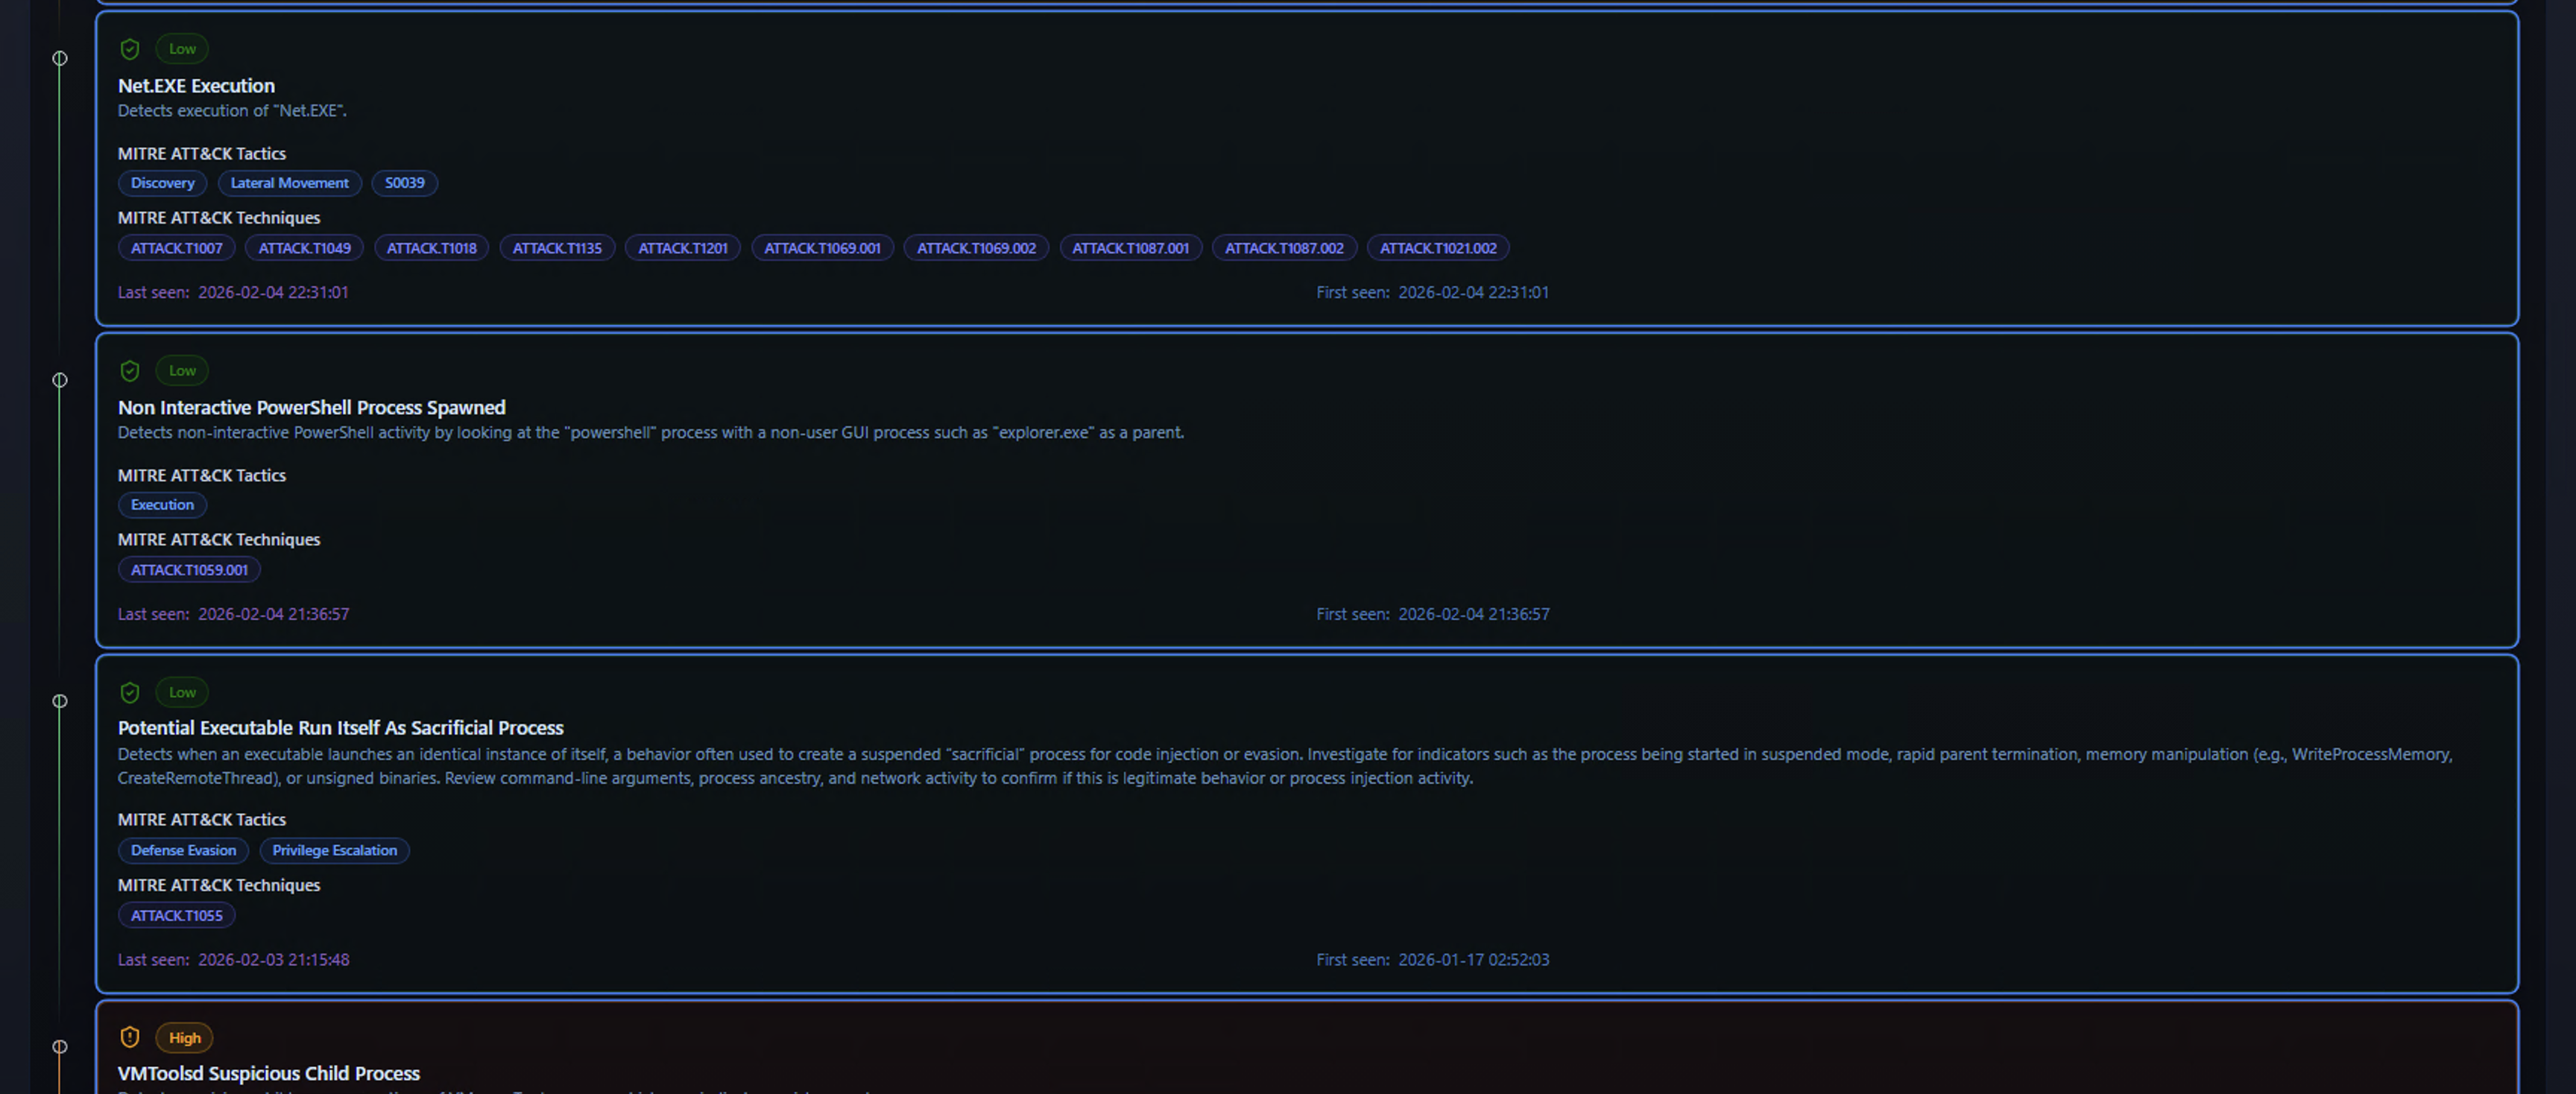
Below the KPIs, each detection is displayed as an alert card containing:
- Severity badge — Color-coded severity level (Critical, High, Medium, Low)
- Alert title — The Sigma rule name that triggered the detection
- Description — What the rule detects and why it matters
- MITRE ATT&CK Tactics — The adversary tactics associated with this detection (e.g., Discovery, Execution, Persistence)
- MITRE ATT&CK Techniques — Specific technique IDs (e.g., ATT&CK.T1003, ATT&CK.T1059)
- First seen / Last seen — The time range over which this alert has been firing for this entity
Alert cards are ordered by severity, with the most critical detections at the top. The combination of MITRE ATT&CK mapping and timestamps helps analysts quickly understand what the adversary is doing and when the activity started.
Toolbar Actions
The top-right toolbar provides three key actions:
| Button | Description |
|---|---|
| Alert Triage | Launch the AI-powered RhythmX Analyst for automated threat analysis |
| Network Graph | Open the ATT&CK Network Graph visualization for this entity |
| Generate Report | Export the investigation as a report (see Reporting) |
Event Details
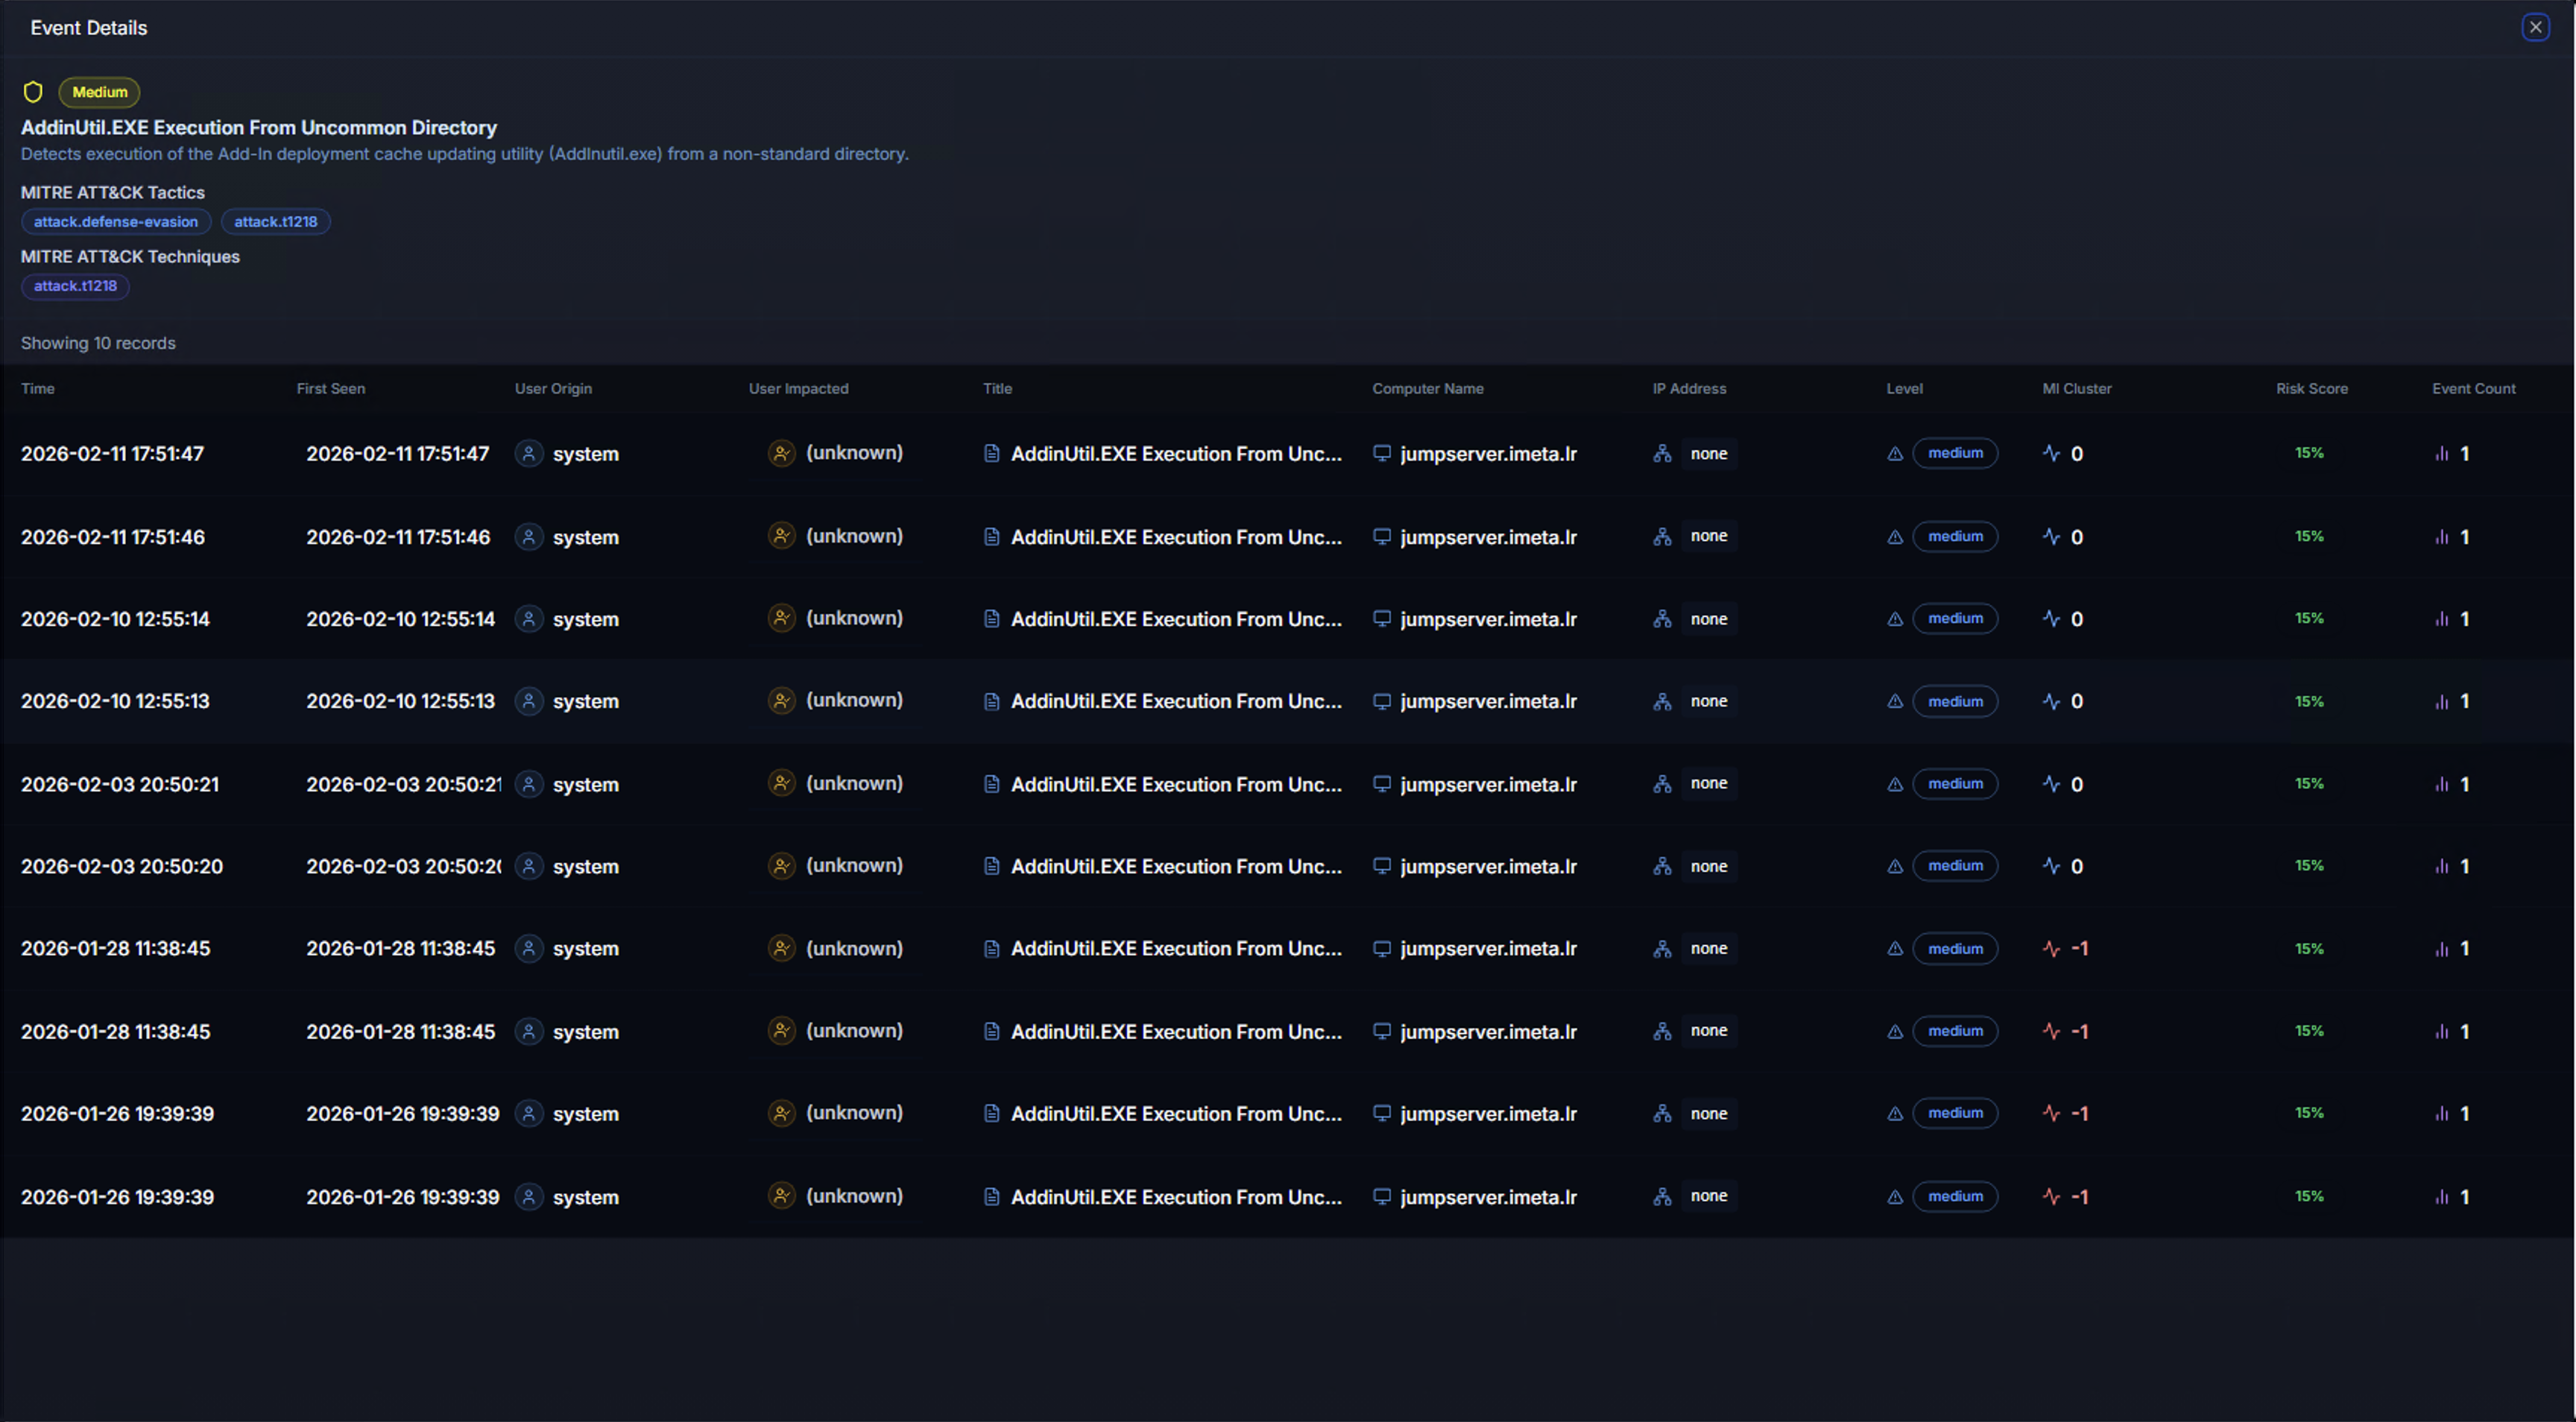
Clicking on an alert card expands the Event Details view, showing every individual occurrence of that detection in a tabular format:
| Column | Description |
|---|---|
| Date | Timestamp of the event |
| First Seen | When this specific event pattern was first observed |
| User Origin | The account that performed the action |
| Title | Sigma rule title for quick reference |
| Computer Name | The system where the event was detected |
| ML Anomaly | Whether the ML model flagged this specific event as anomalous |
Clicking on any row in the event table opens the Alert Detail Panel on the right side of the screen.
Alert Detail Panel
The Alert Detail Panel provides deep context for a selected event. It is organized into multiple sections that give the analyst everything needed to make a triage decision without leaving the page.
Risk Assessment & Alert Overview
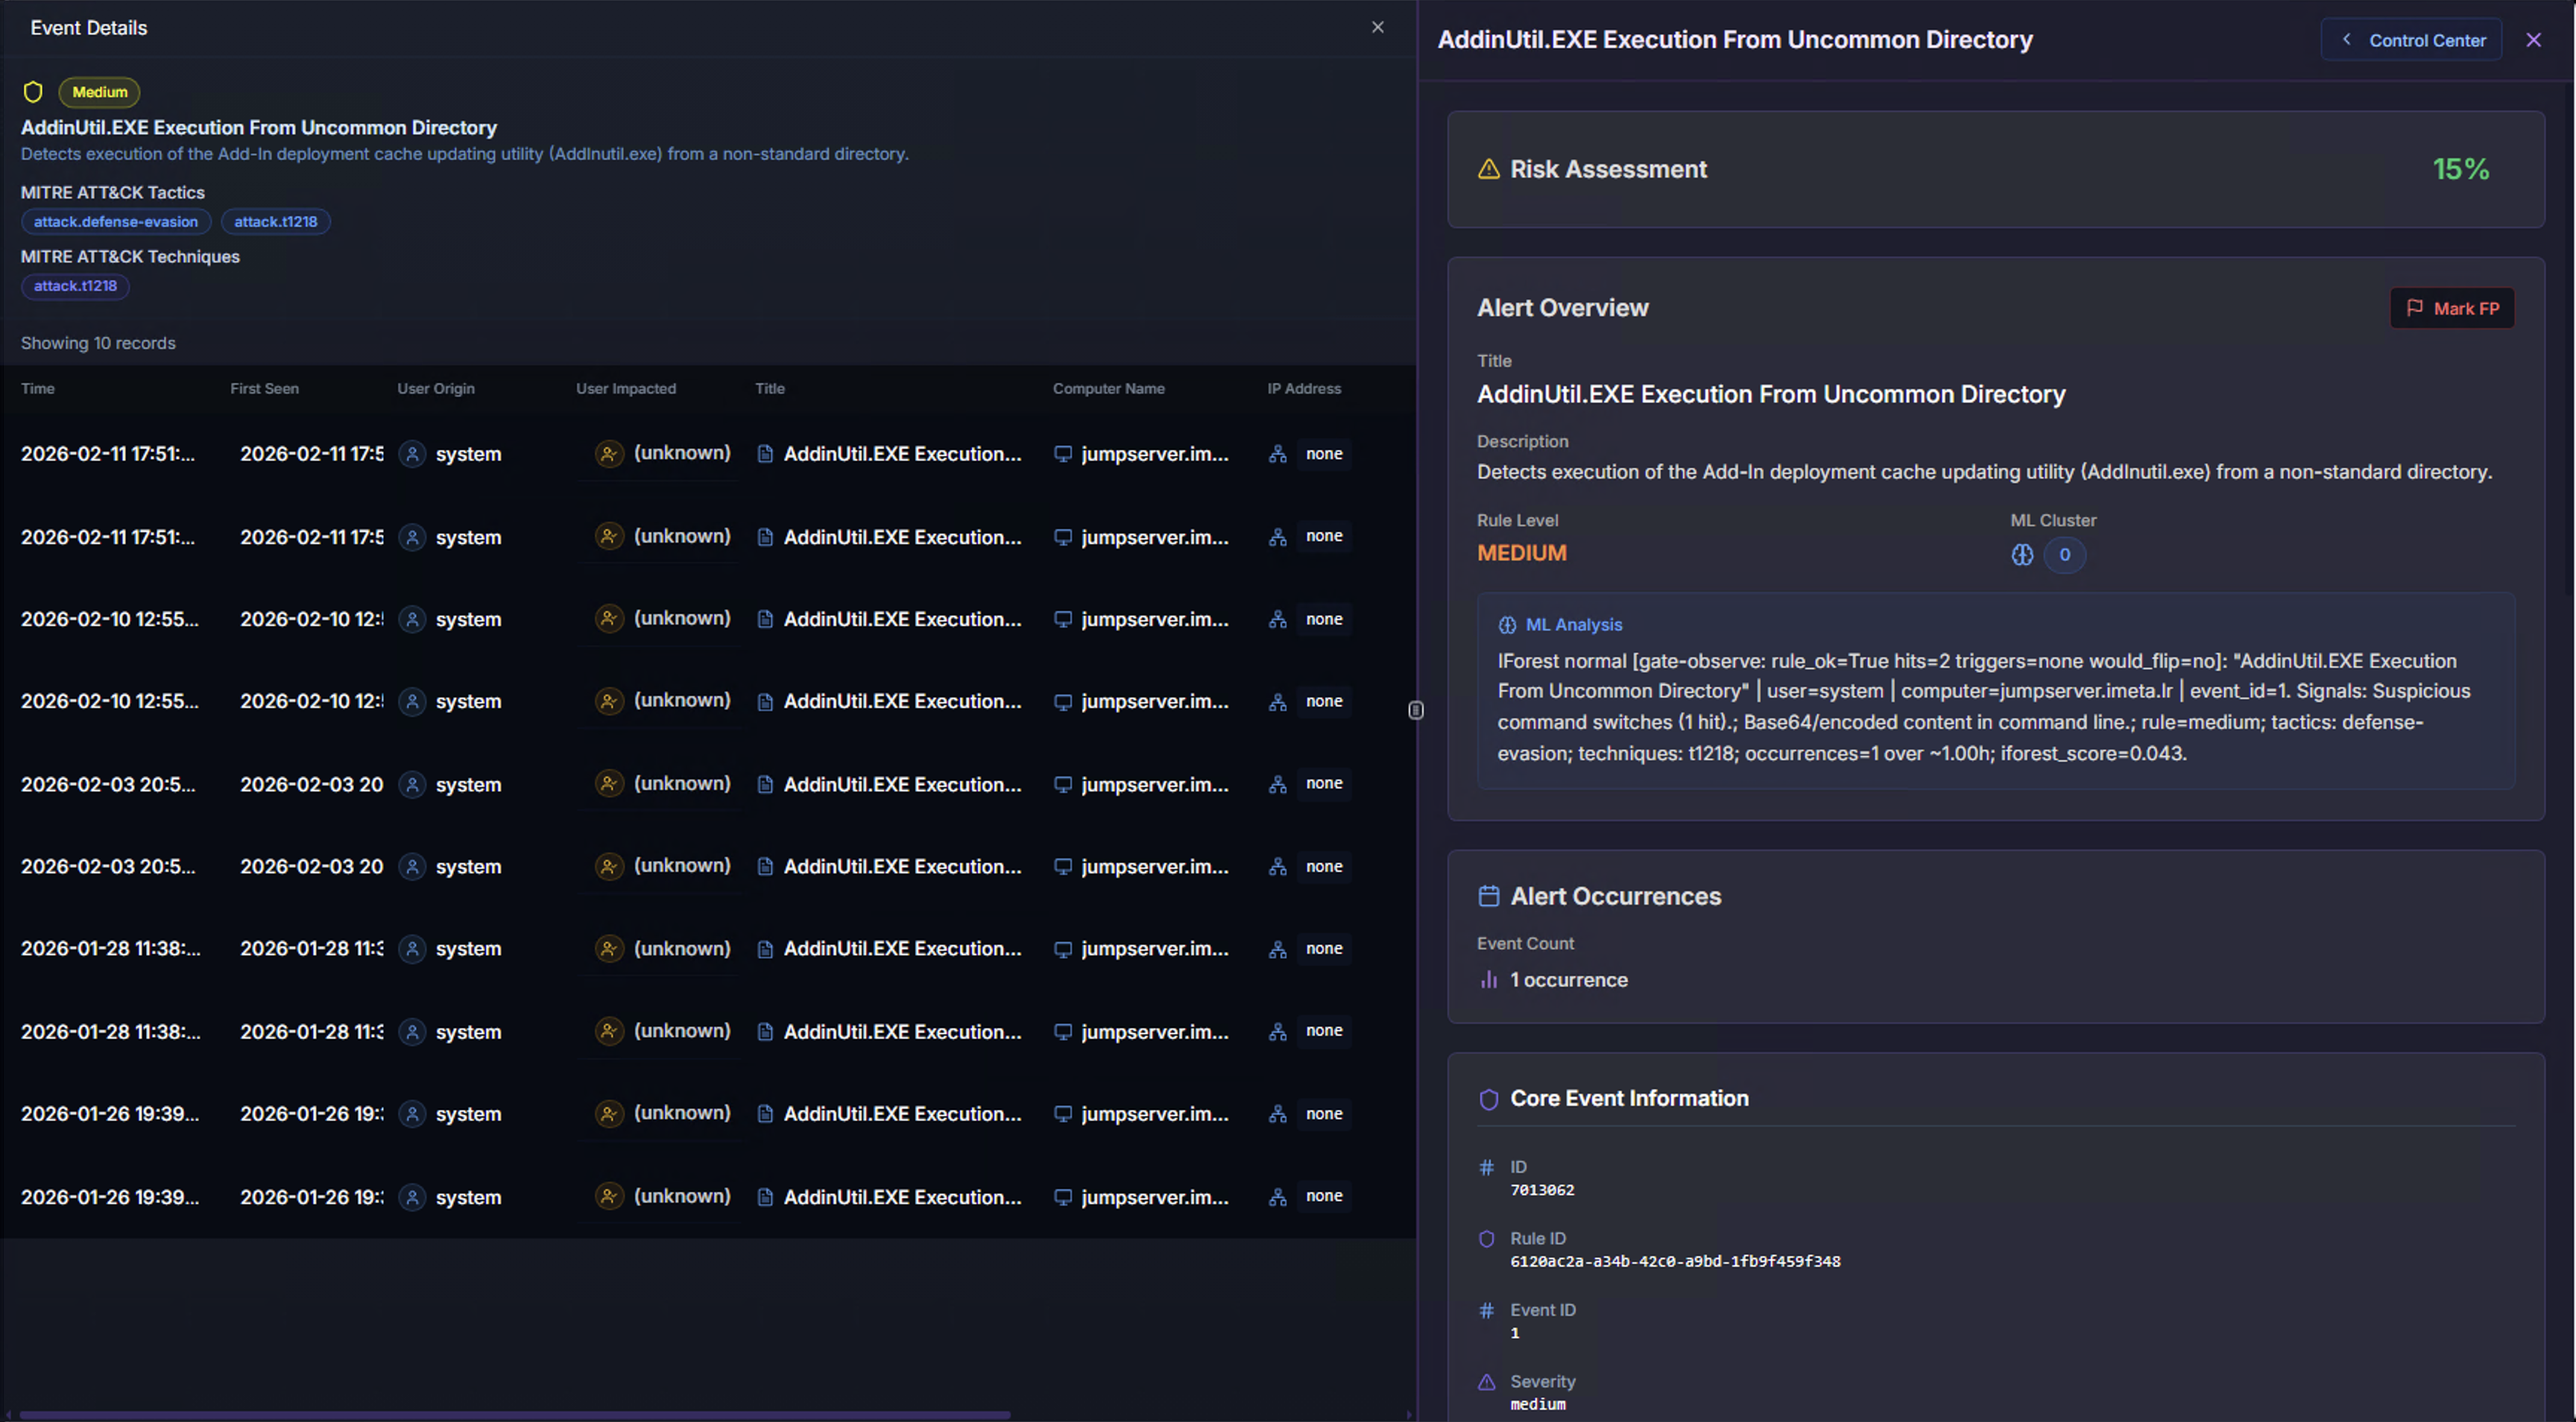
| Section | What It Shows |
|---|---|
| Risk Assessment | A percentage-based risk score calculated from severity, ML anomaly status, and entity context |
| Alert Overview | The Sigma rule description, risk level, and ML classification |
| ML Analysis | The ML detection output showing what the anomaly detection engine identified |
| Alert Occurrences | How many times this specific alert has fired — a single occurrence may indicate targeted activity, while many occurrences may indicate persistent behavior |
| Core Event Information | Unique identifiers including Event ID, Rule ID, and classification metadata |
User, System & Process Context
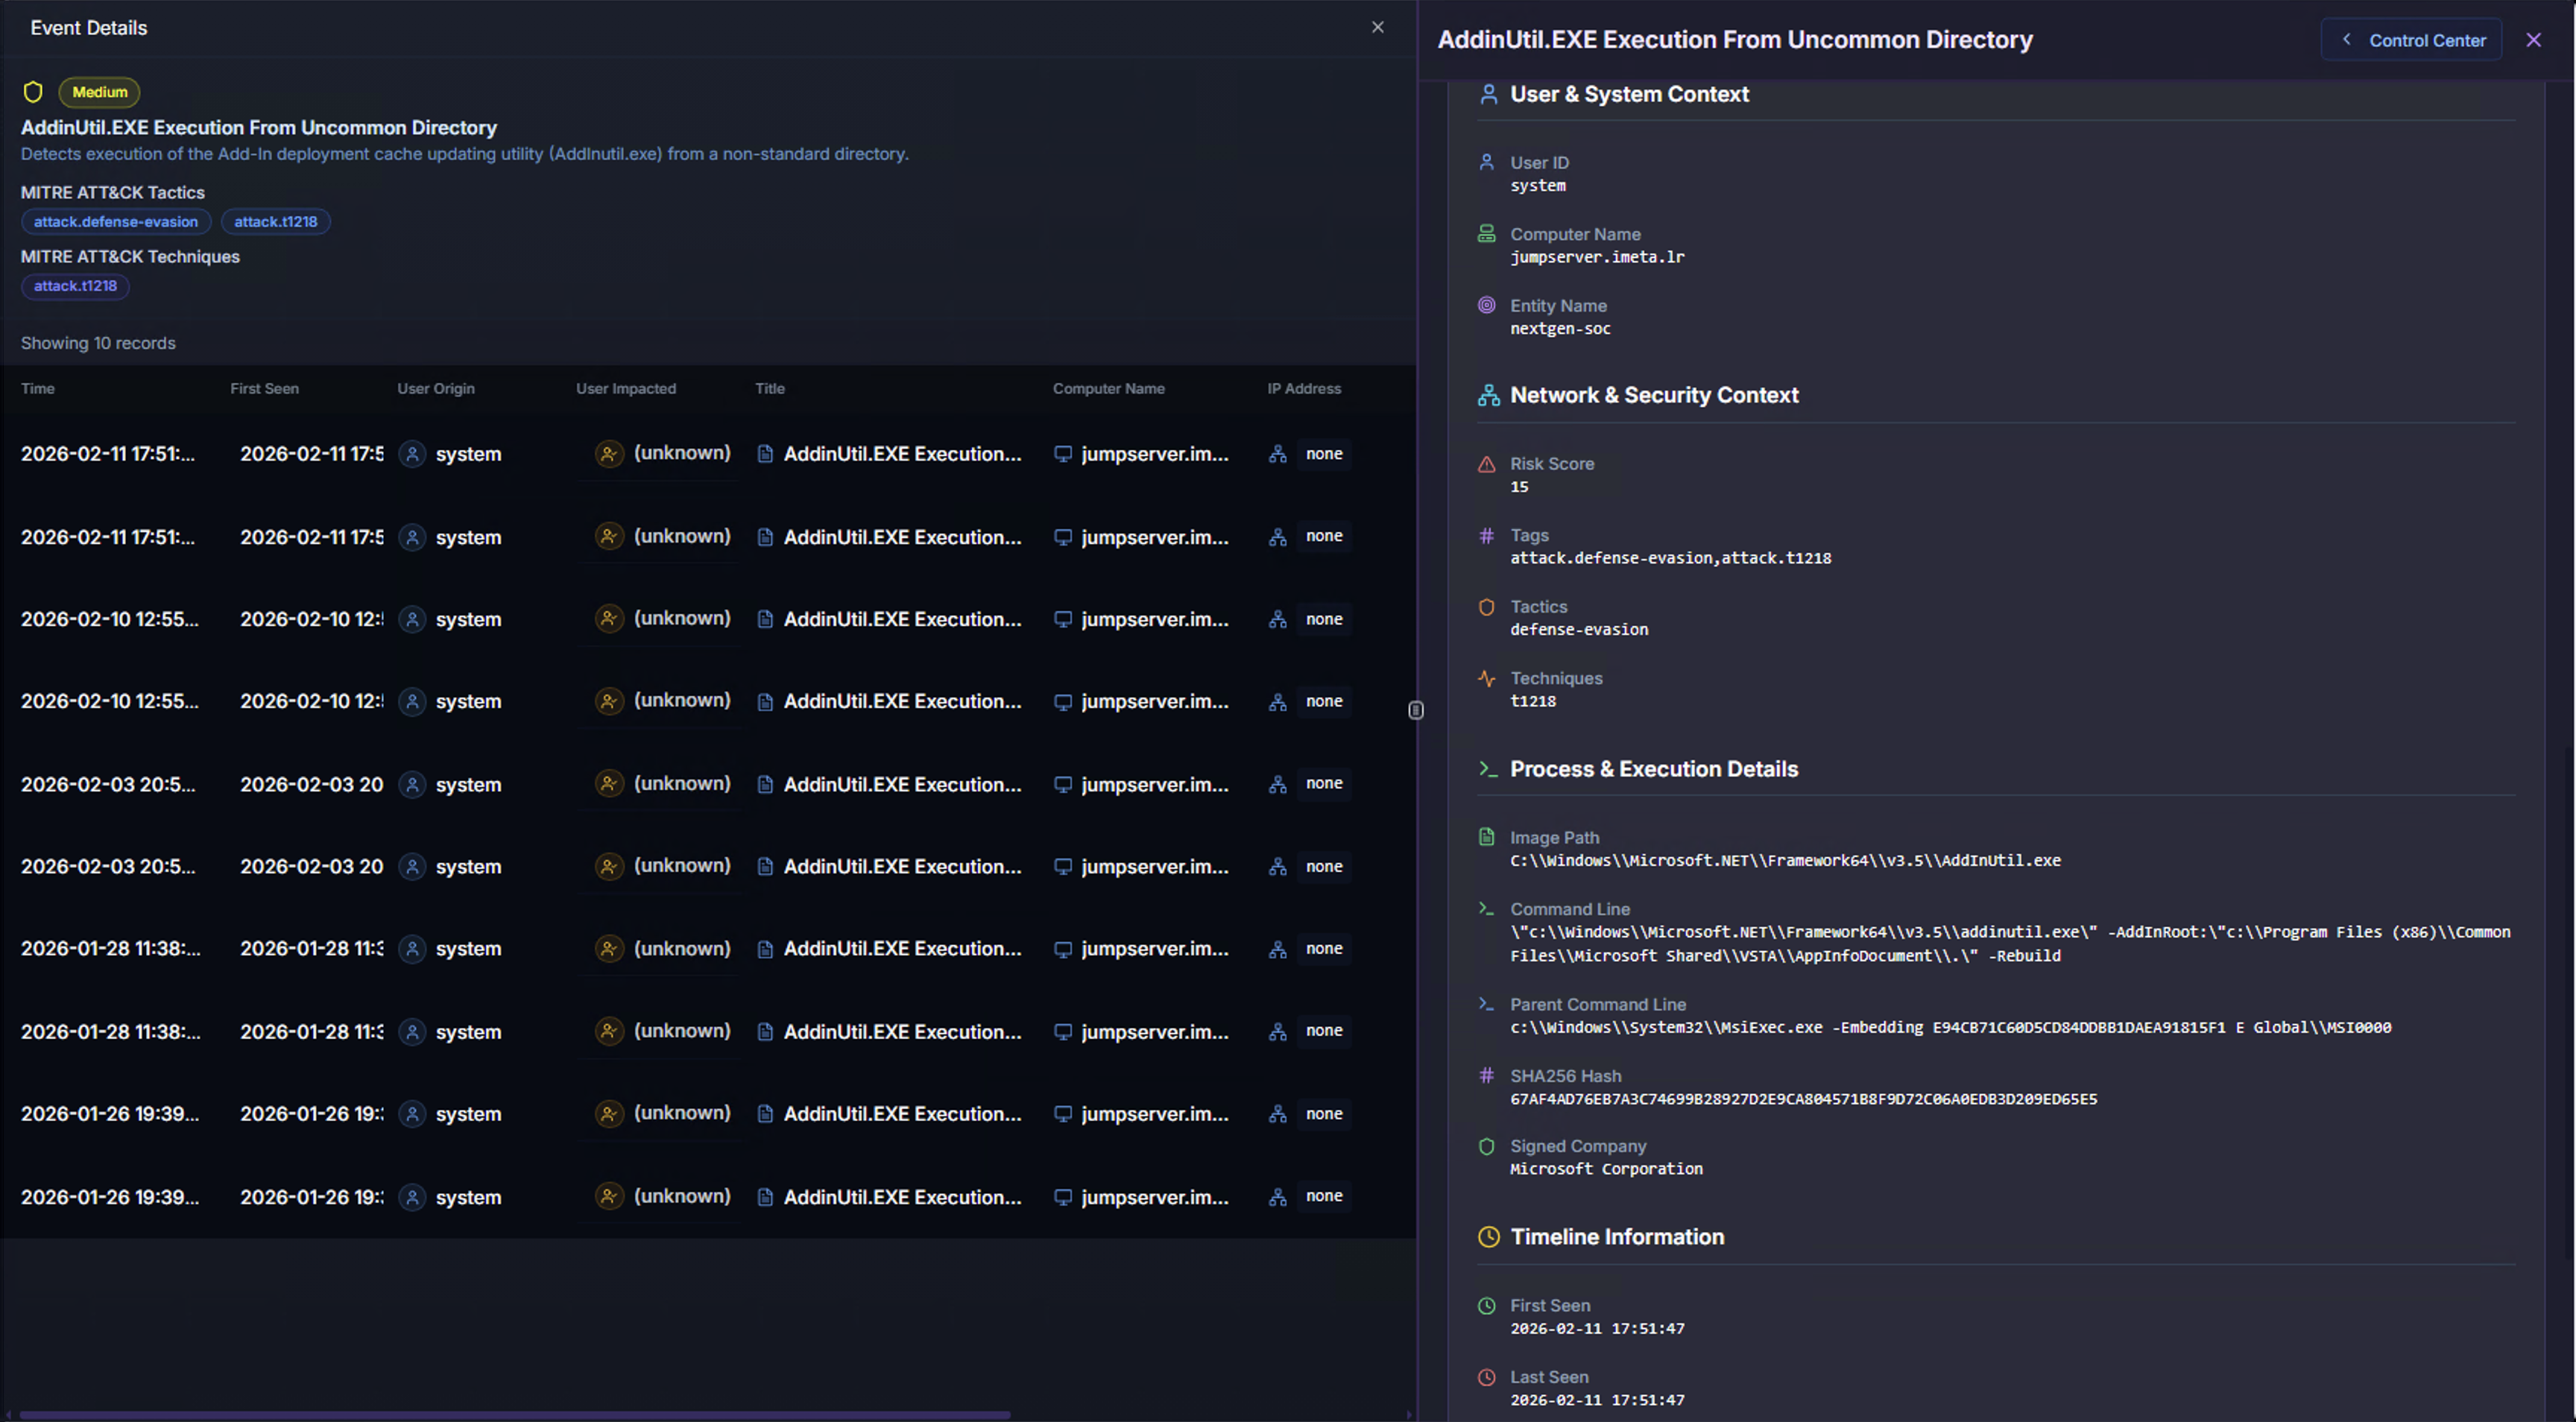
| Section | What It Shows |
|---|---|
| User & System Context | The user account involved, the system name, and account type (e.g., system, service, user) |
| Network & Security Context | Risk score, associated tags, ATT&CK technique references, and security classification |
| Process & Execution Details | The full process chain — Image Path (the executable that ran), Command Line (exact arguments used), and Parent Command Line (what spawned the process). This is critical for determining whether the execution is legitimate or malicious |
| Timeline Information | First and last seen timestamps for this specific event occurrence |
MITRE ATT&CK & Raw Log
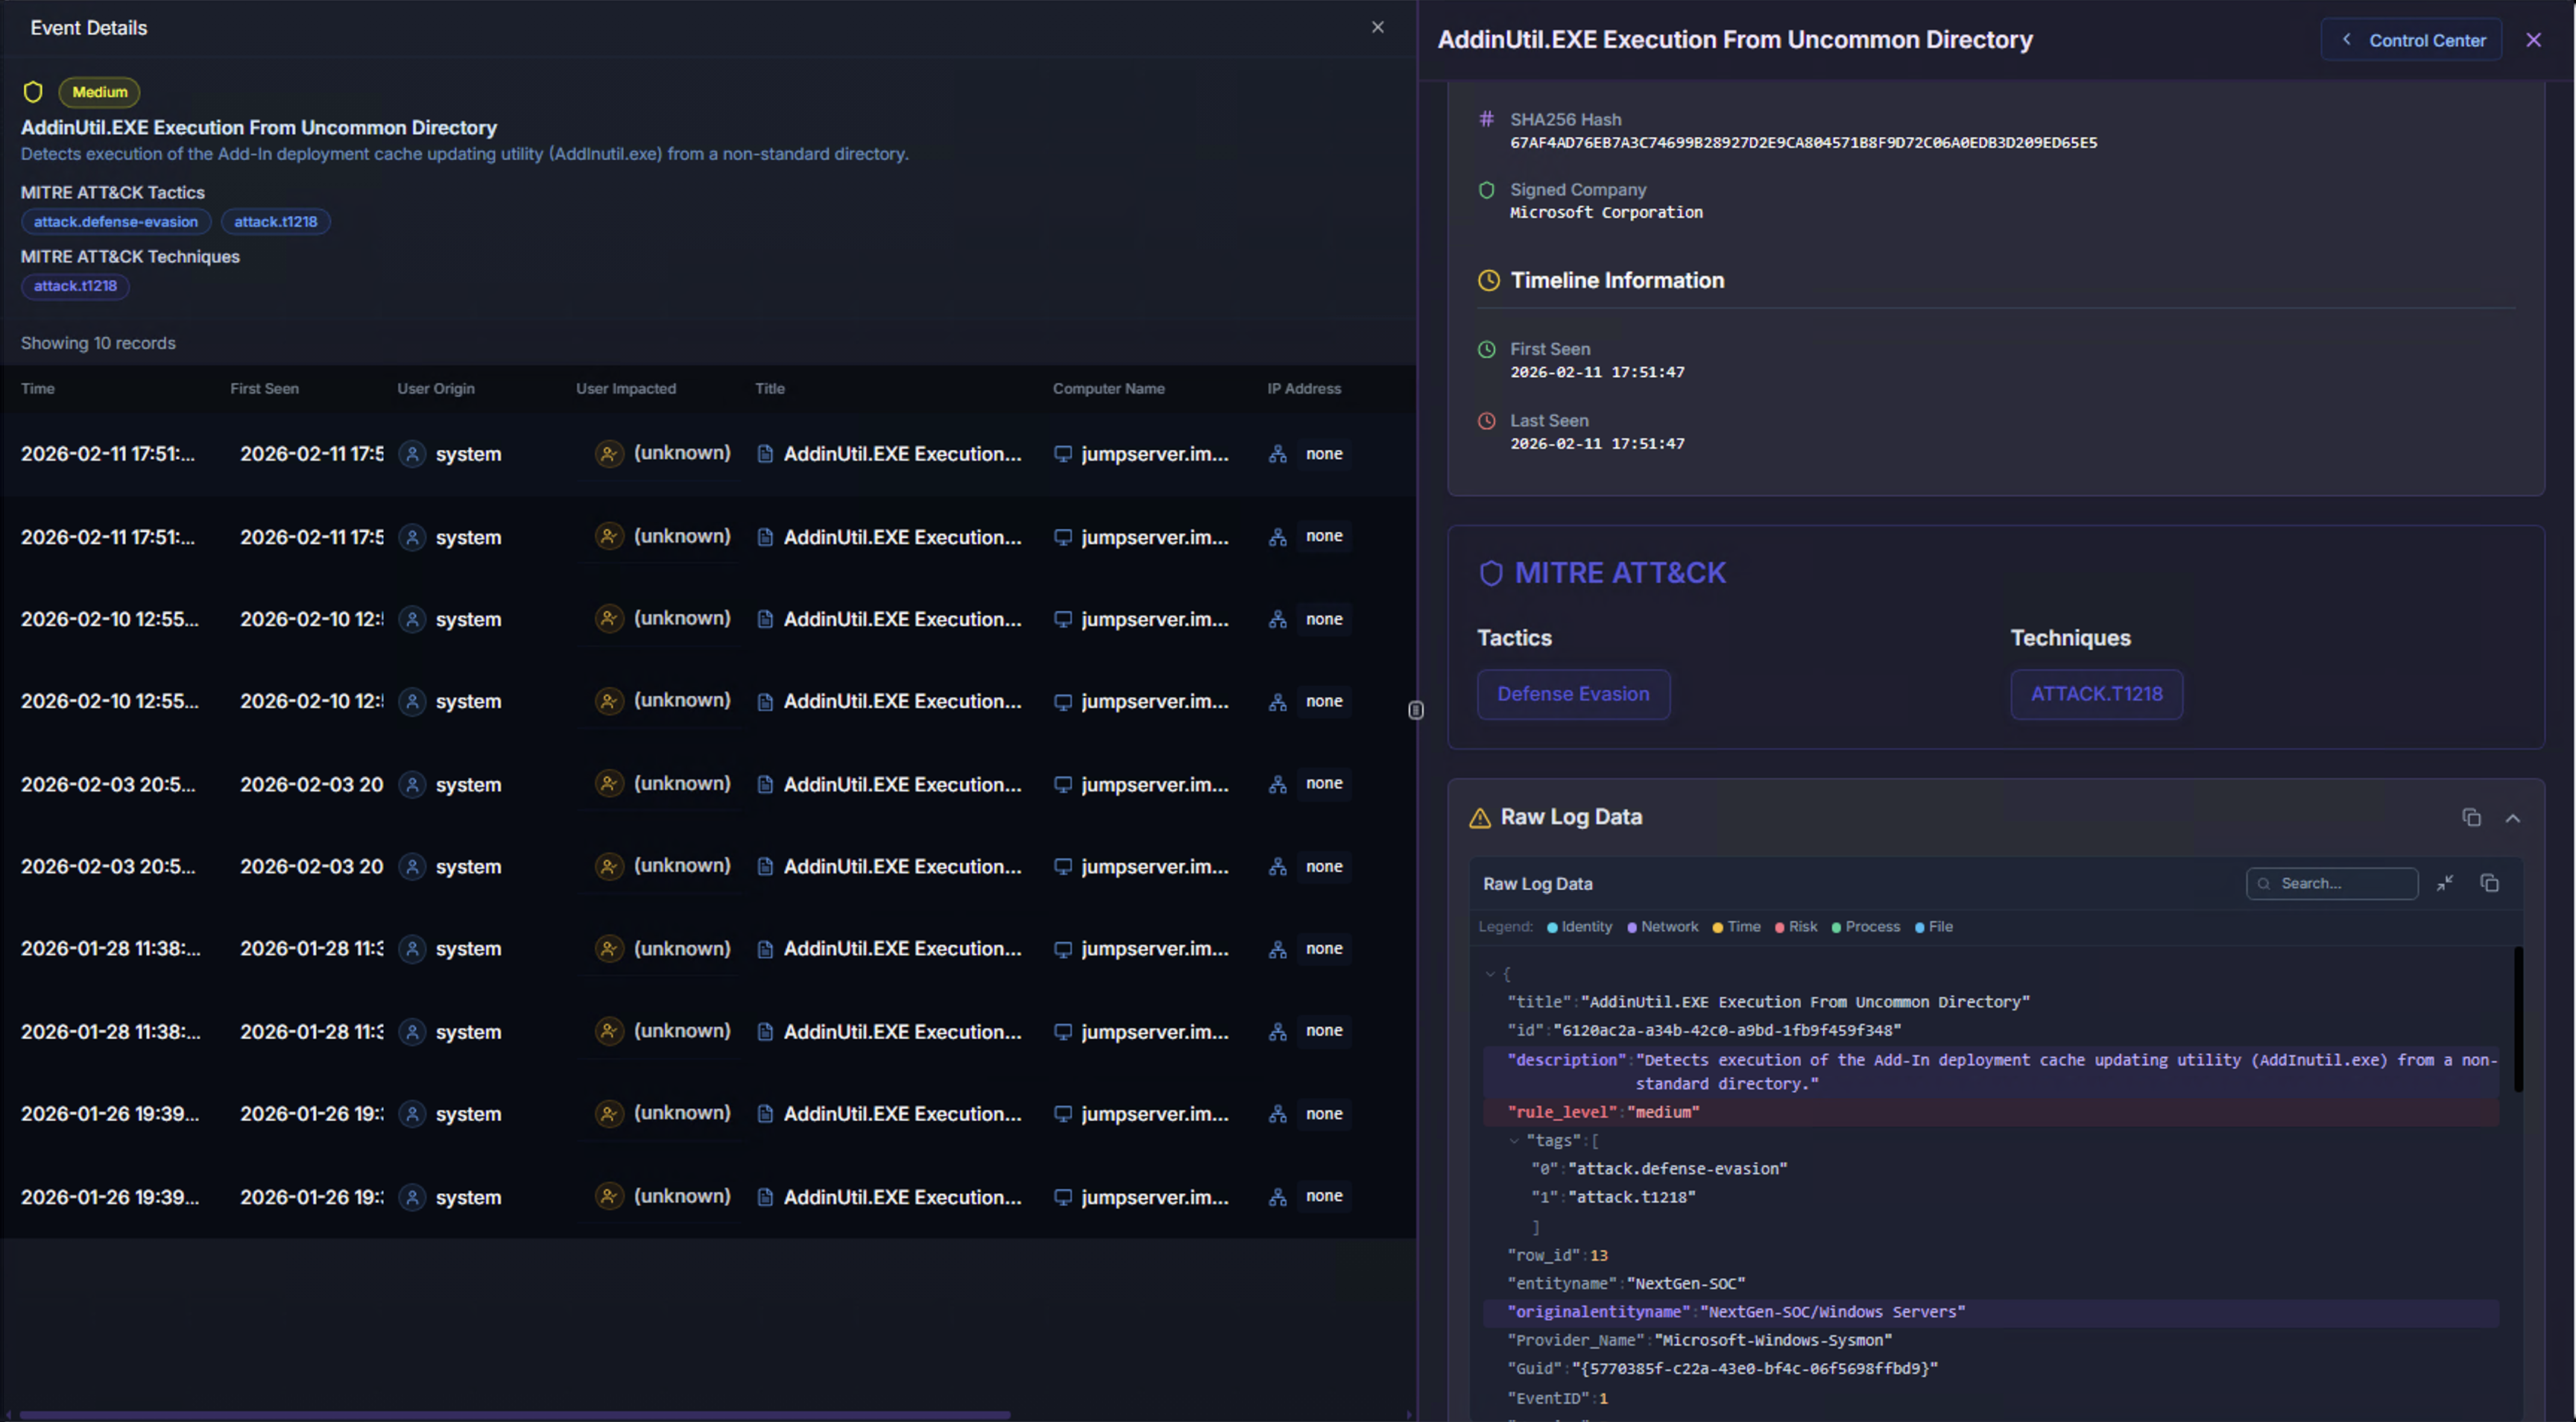
| Section | What It Shows |
|---|---|
| MITRE ATT&CK | Mapped tactics and techniques with clickable references. Helps analysts understand where in the kill chain this activity falls |
| Raw Log Data | The complete original log event in JSON format. Contains every field from the source log — useful for writing custom queries, pivoting to Hunt Mode, or sharing with other teams |
ATT&CK Network Graph
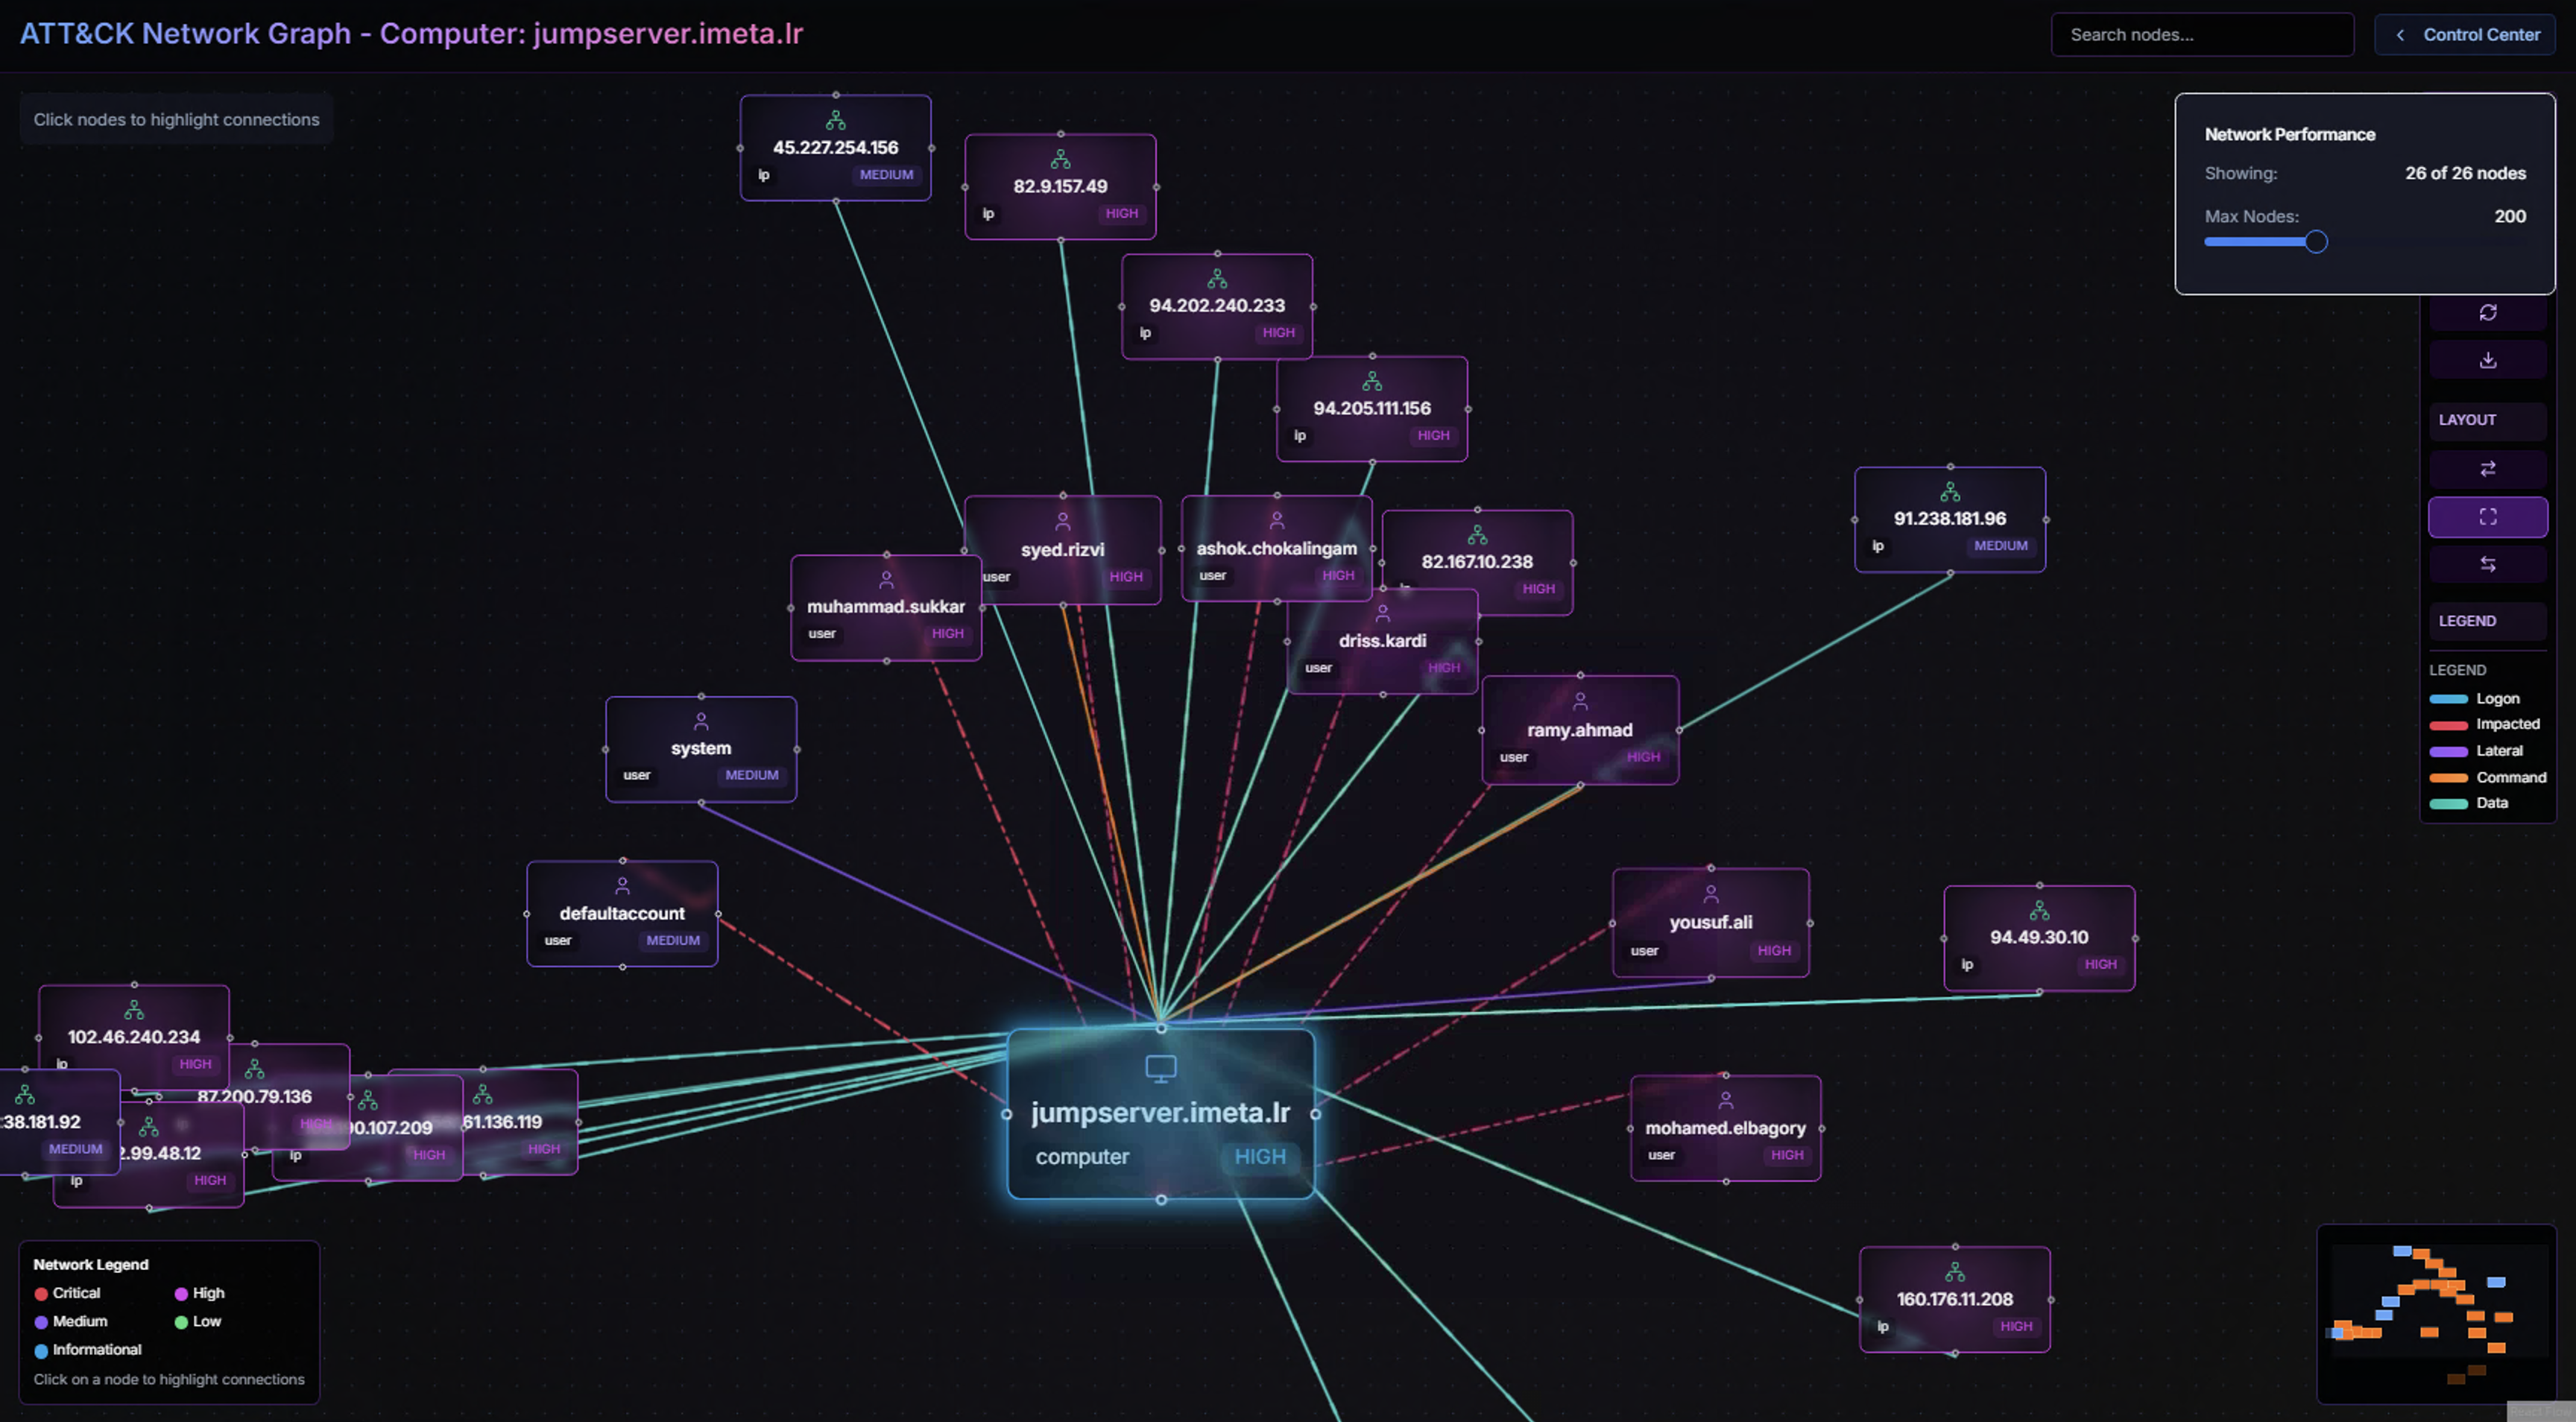
Click Network Graph in the toolbar to open a visual representation of all relationships for the selected entity.
The graph places the investigated entity at the center and maps all connected entities around it:
- Users — Accounts that have interacted with this system
- Systems — Other computers connected to or from this entity
- IP Addresses — External and internal IPs associated with activity
- Connection lines — Color-coded by severity (red = critical/high, yellow = medium, green = low)
Graph Controls
| Control | Description |
|---|---|
| Search | Find specific nodes by name |
| Max Nodes | Adjust the number of displayed nodes for performance |
| Layout | Switch between graph layout algorithms |
| Legend | Color coding by severity and entity type |
| Mini-map | Overview of the full graph for navigation |
Node Details
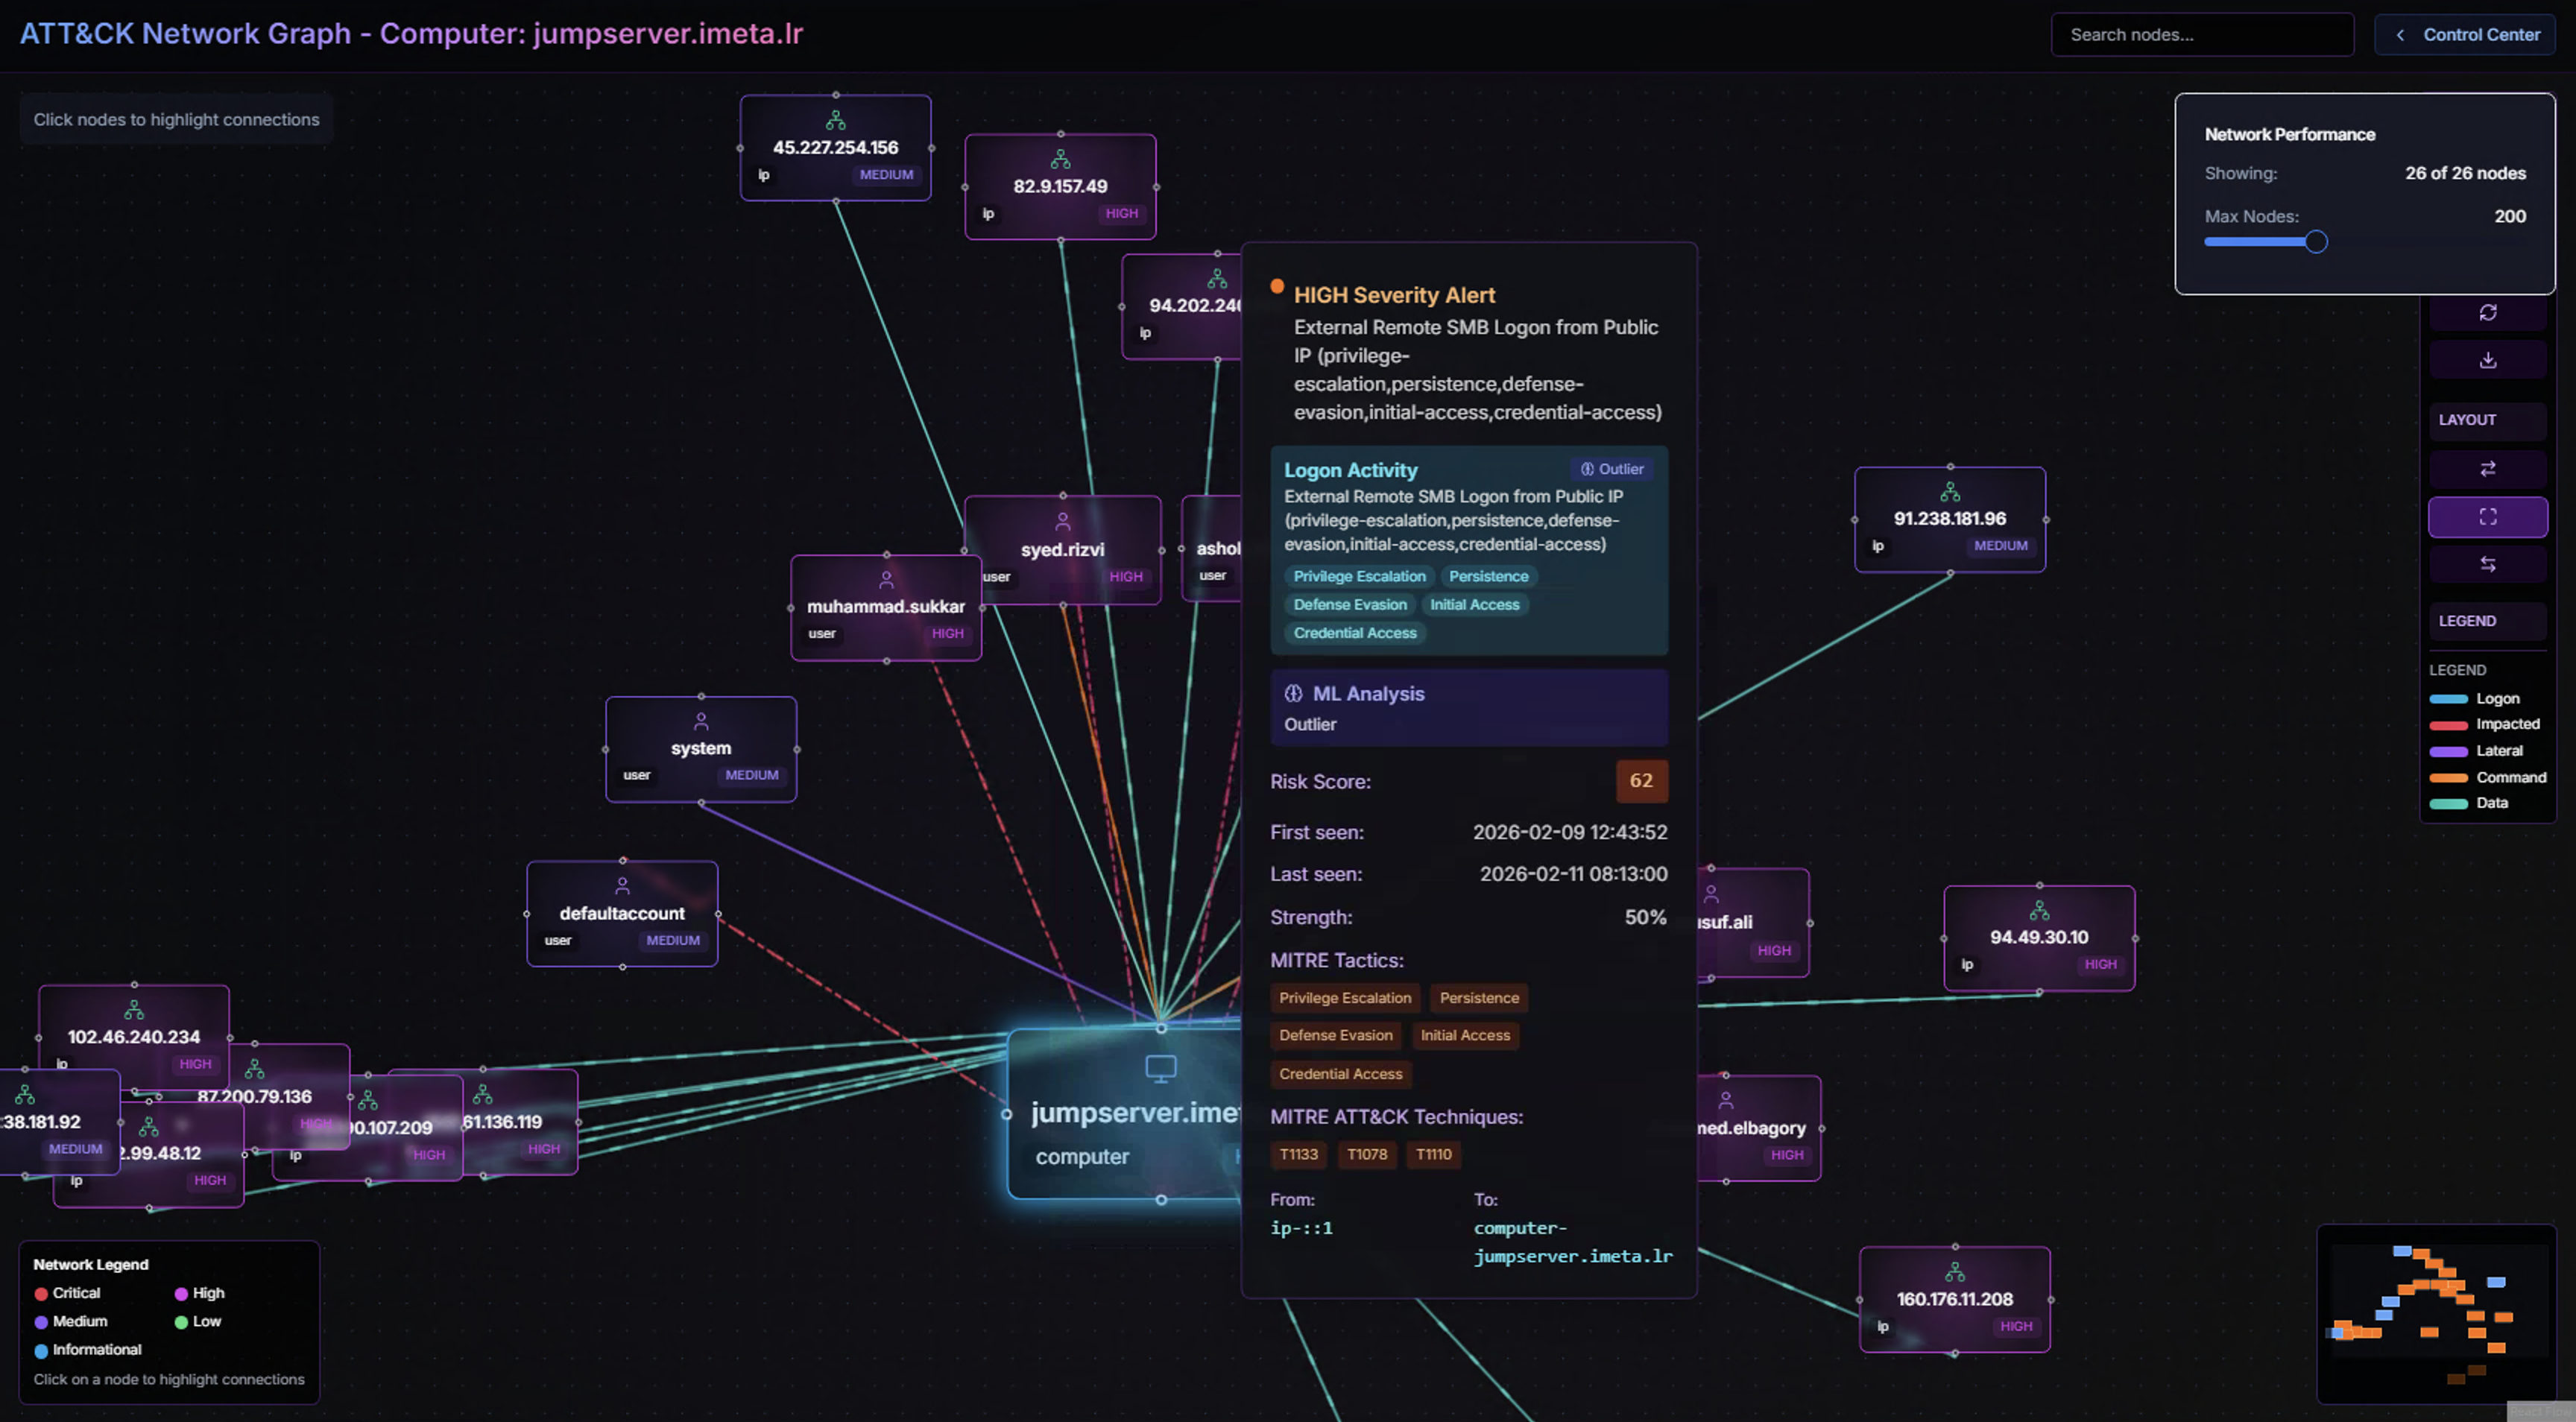
Clicking on any node or connection in the graph reveals a detail popup showing:
- Alert severity and title — The highest-severity alert associated with this connection
- Logon Activity — Account and logon type details for the relationship
- ML Analysis indicator — Whether the ML model flagged this specific connection as anomalous
- Risk Score — Numerical risk assessment for this relationship
- Strength — Connection strength as a percentage based on alert volume
- MITRE ATT&CK Tactics & Techniques — Kill chain mapping for the associated alerts
The Network Graph is particularly valuable for identifying lateral movement patterns — where an adversary moves from one compromised system to the next, leaving a trail of connections that form a visible path through the graph.
AI-Powered Alert Triage
RhythmX includes a built-in AI analyst that provides automated threat assessment. Click Alert Triage in the toolbar to launch the analysis.
Processing
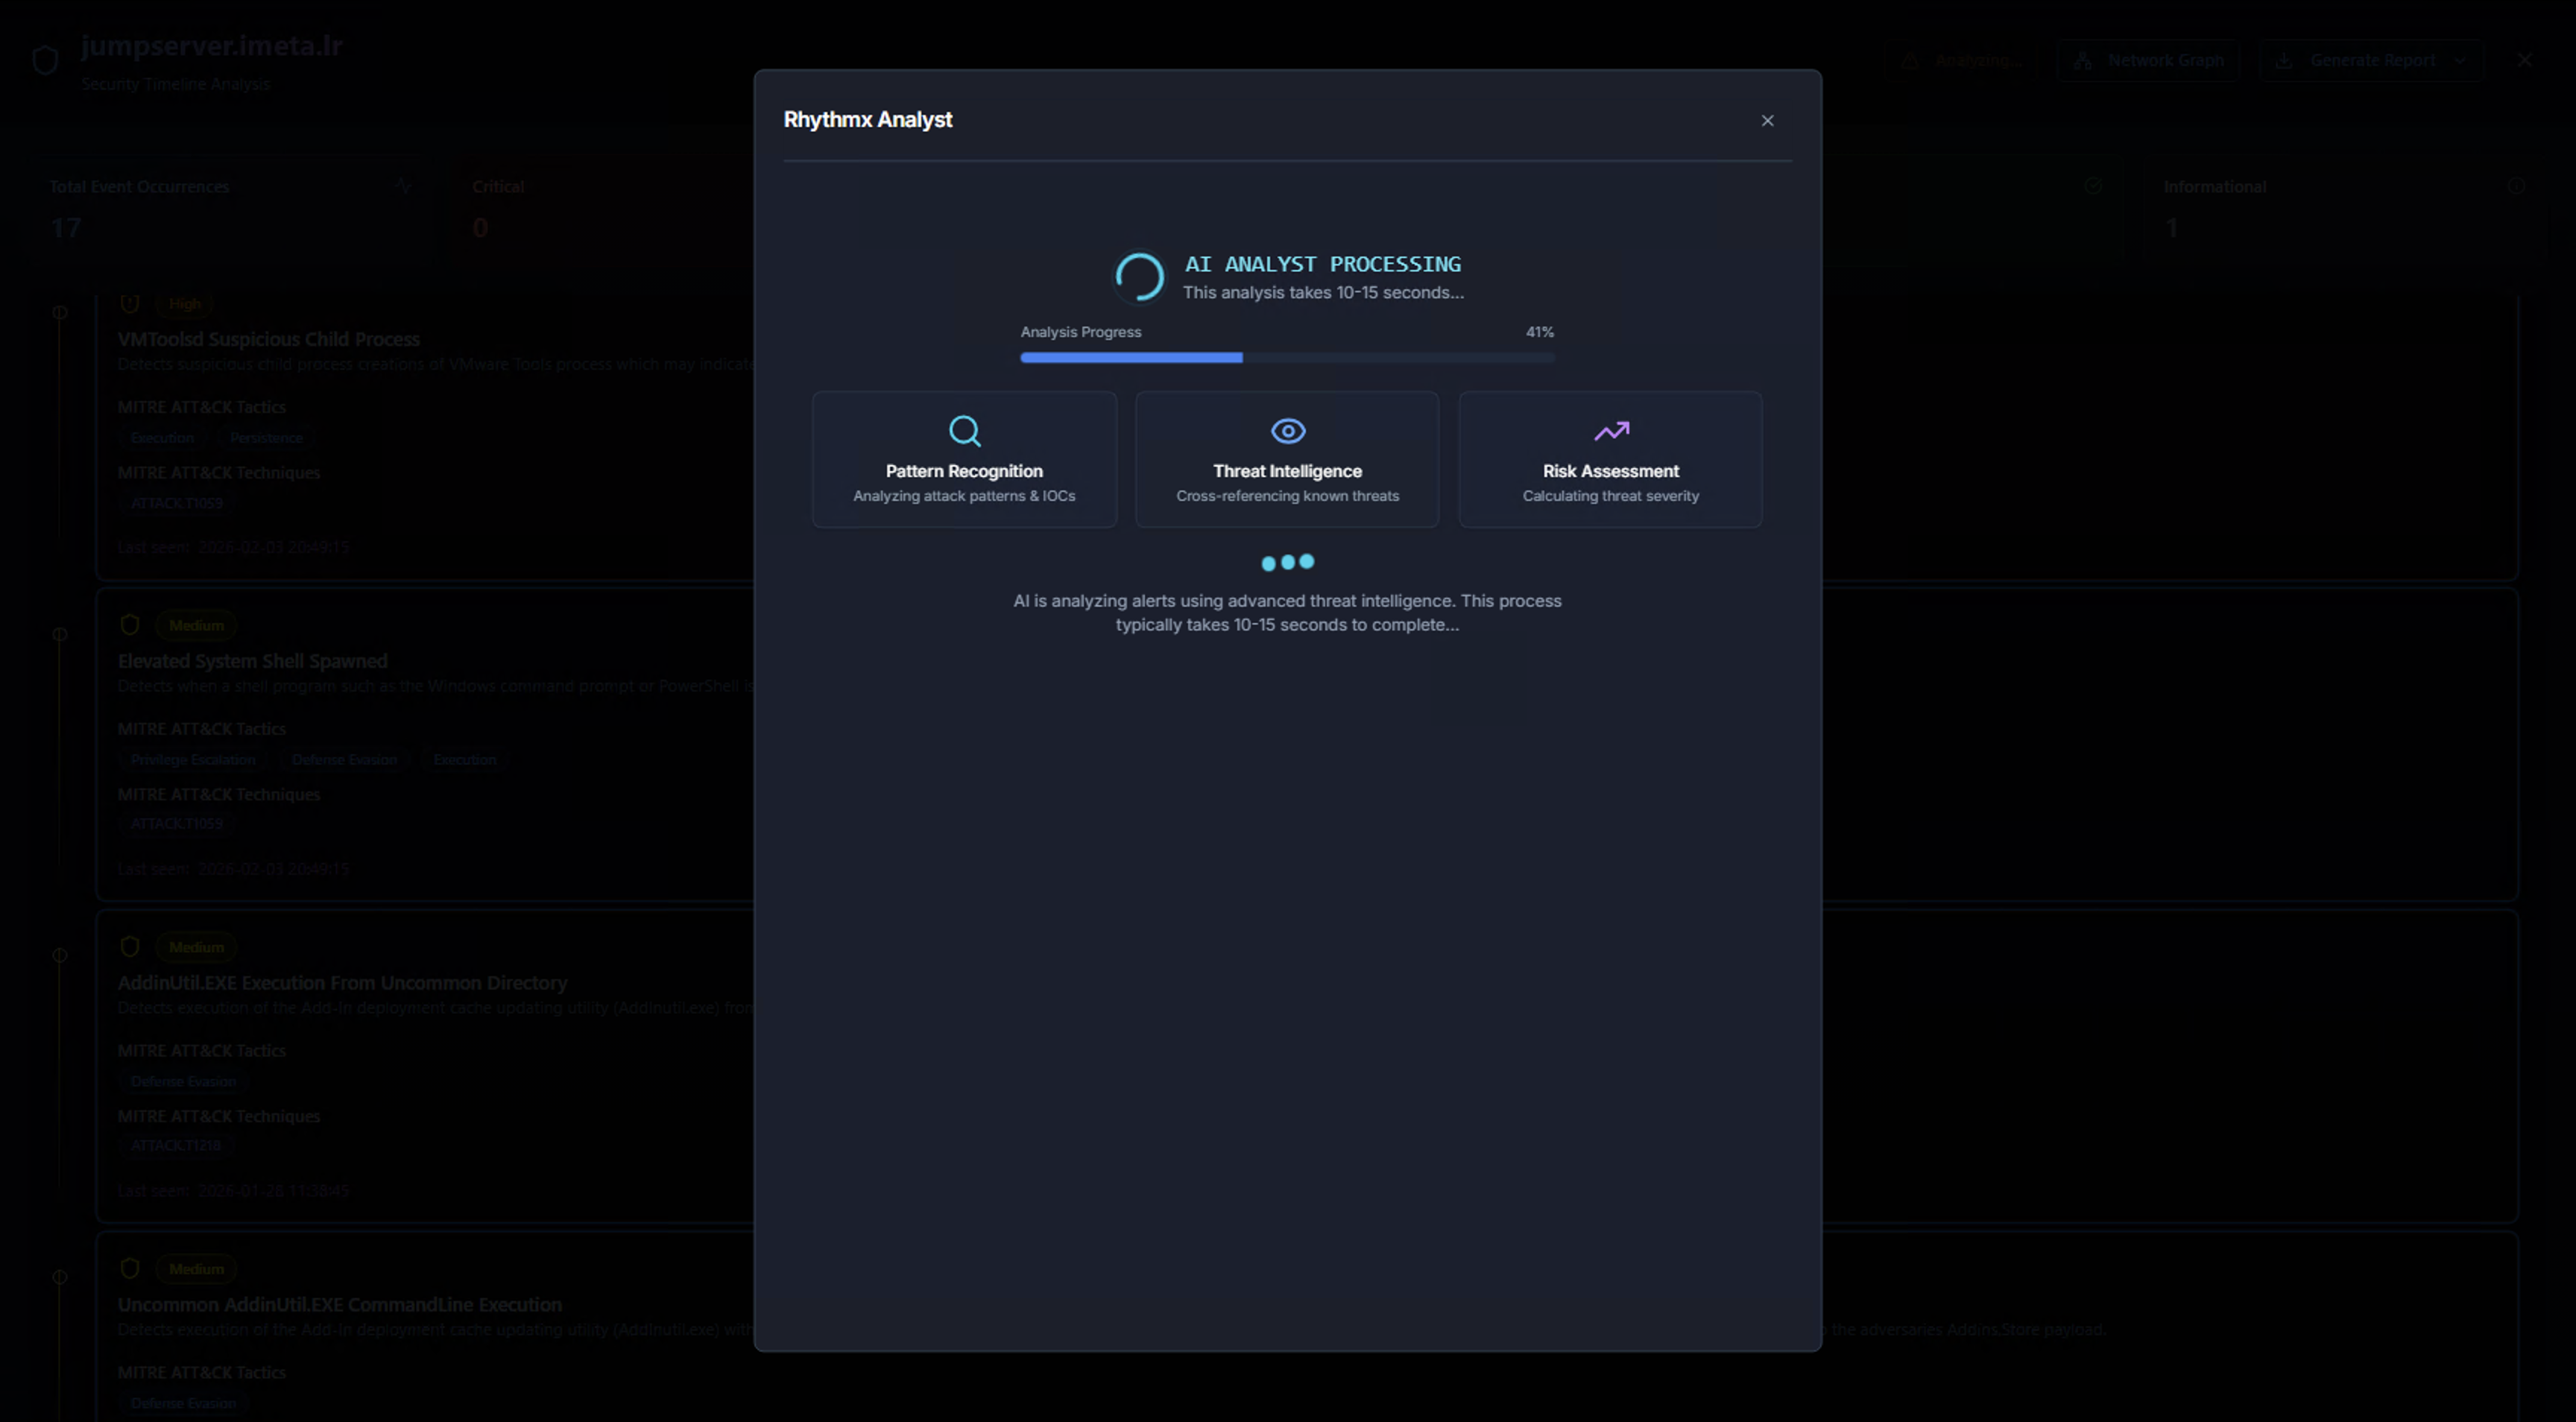
The RhythmX Analyst runs a multi-stage analysis pipeline:
- Pattern Recognition — Analyzes attack patterns and indicators of compromise (IOCs)
- Threat Intelligence — Cross-references known threats and adversary techniques
- Risk Assessment — Calculates overall threat severity based on combined signals
The analysis typically completes in 10–15 seconds.
AI Analysis Results
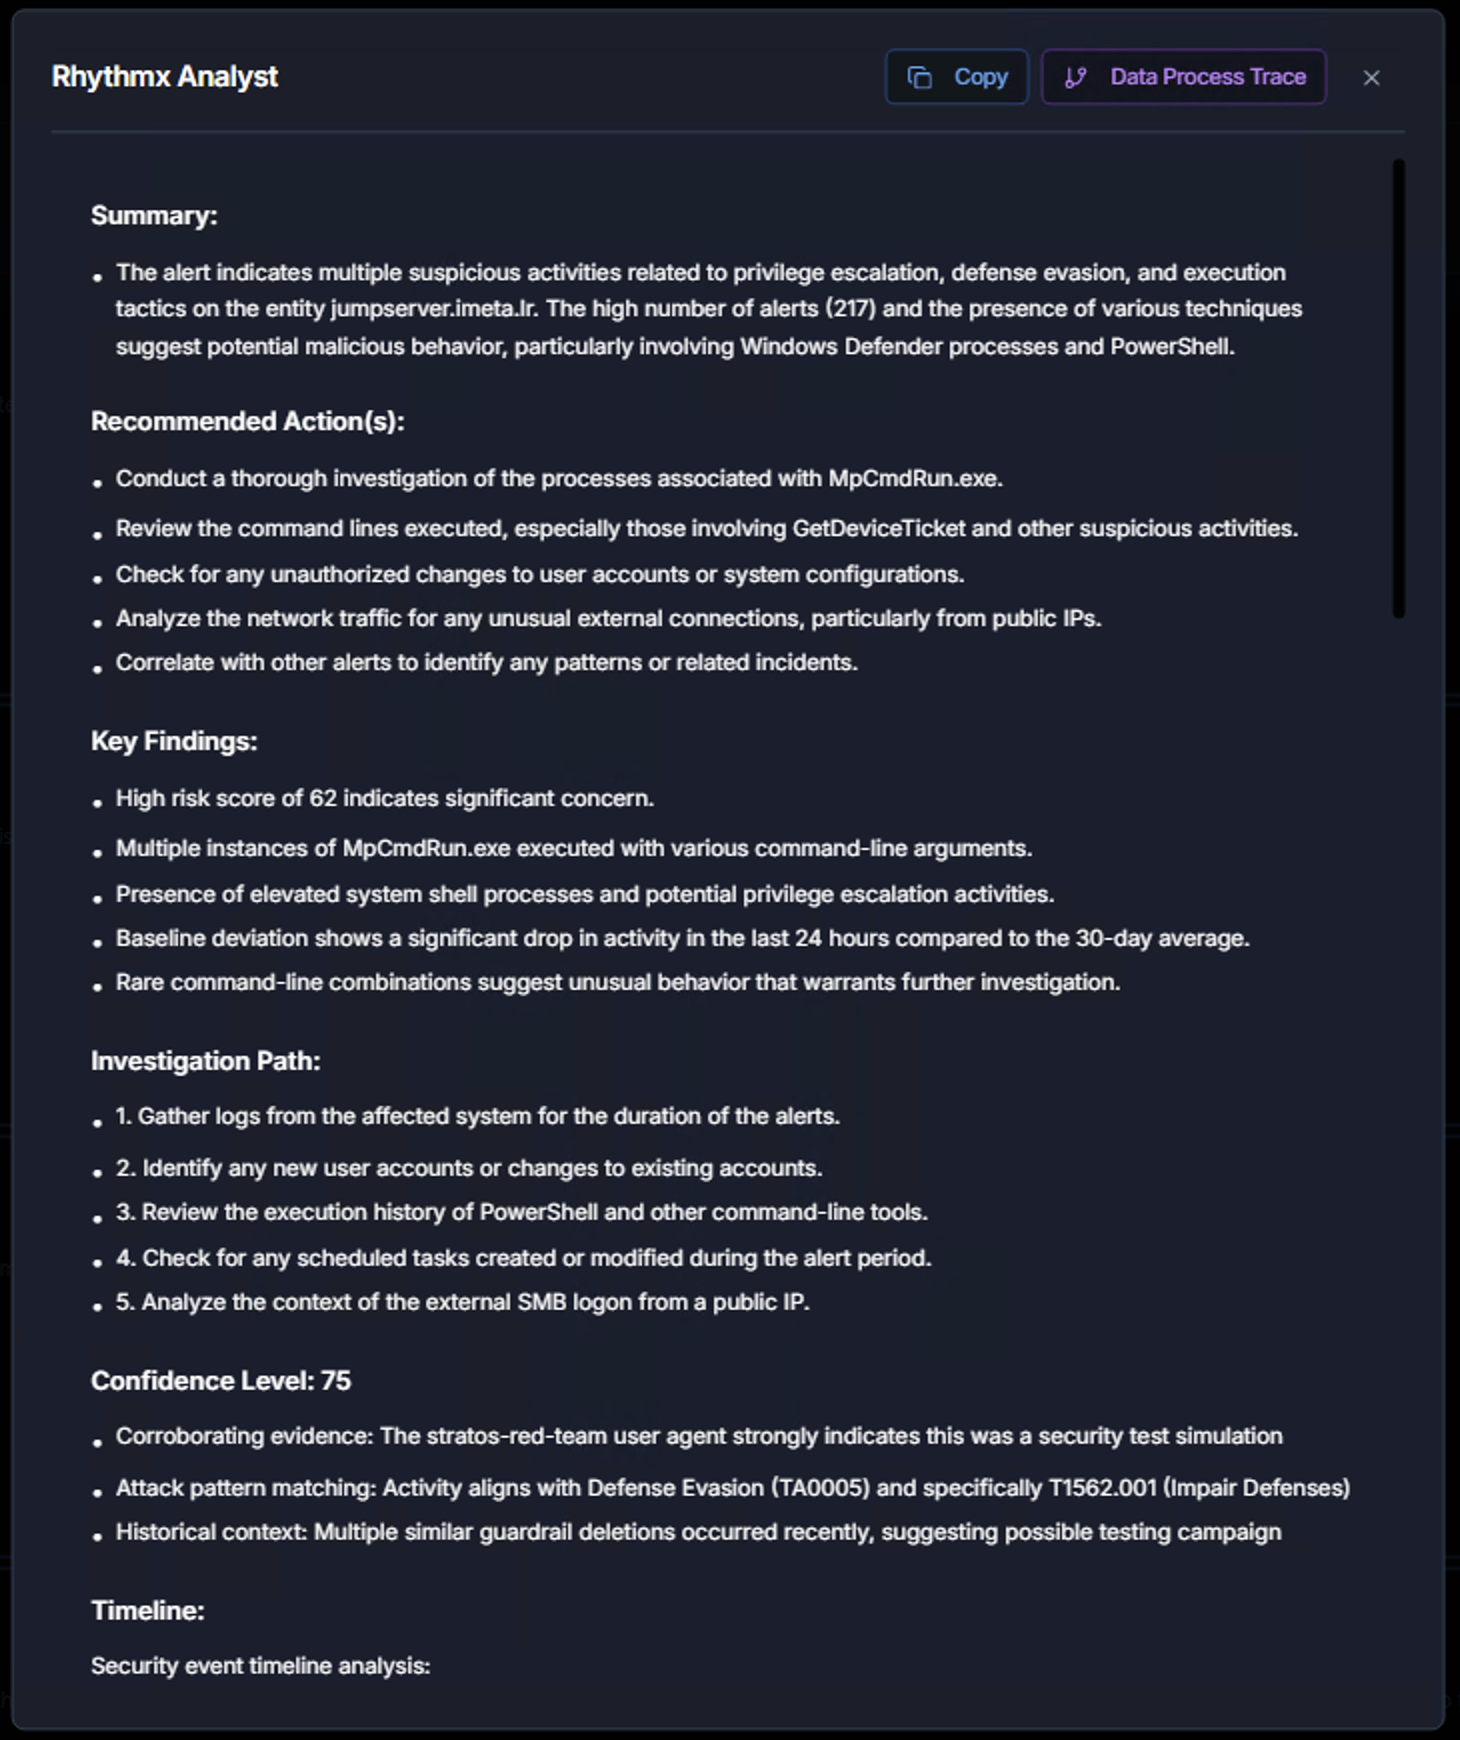
The completed analysis provides a structured report:
| Section | What It Contains |
|---|---|
| Summary | A concise overview of the detected activity, including the nature of the threat, the number of alerts, and the primary concern areas |
| Recommended Actions | Specific, actionable steps the analyst should take — e.g., investigate specific processes, review command lines, check for unauthorized changes, analyze network traffic |
| Key Findings | The most important observations from the analysis — risk score significance, unusual process patterns, baseline deviations, and rare activity combinations |
| Investigation Path | A numbered, step-by-step investigation workflow tailored to this specific threat scenario |
| Confidence Level | How confident the AI model is in its assessment (0–100), with supporting evidence explaining the confidence rating |
Baseline Deviation Analysis
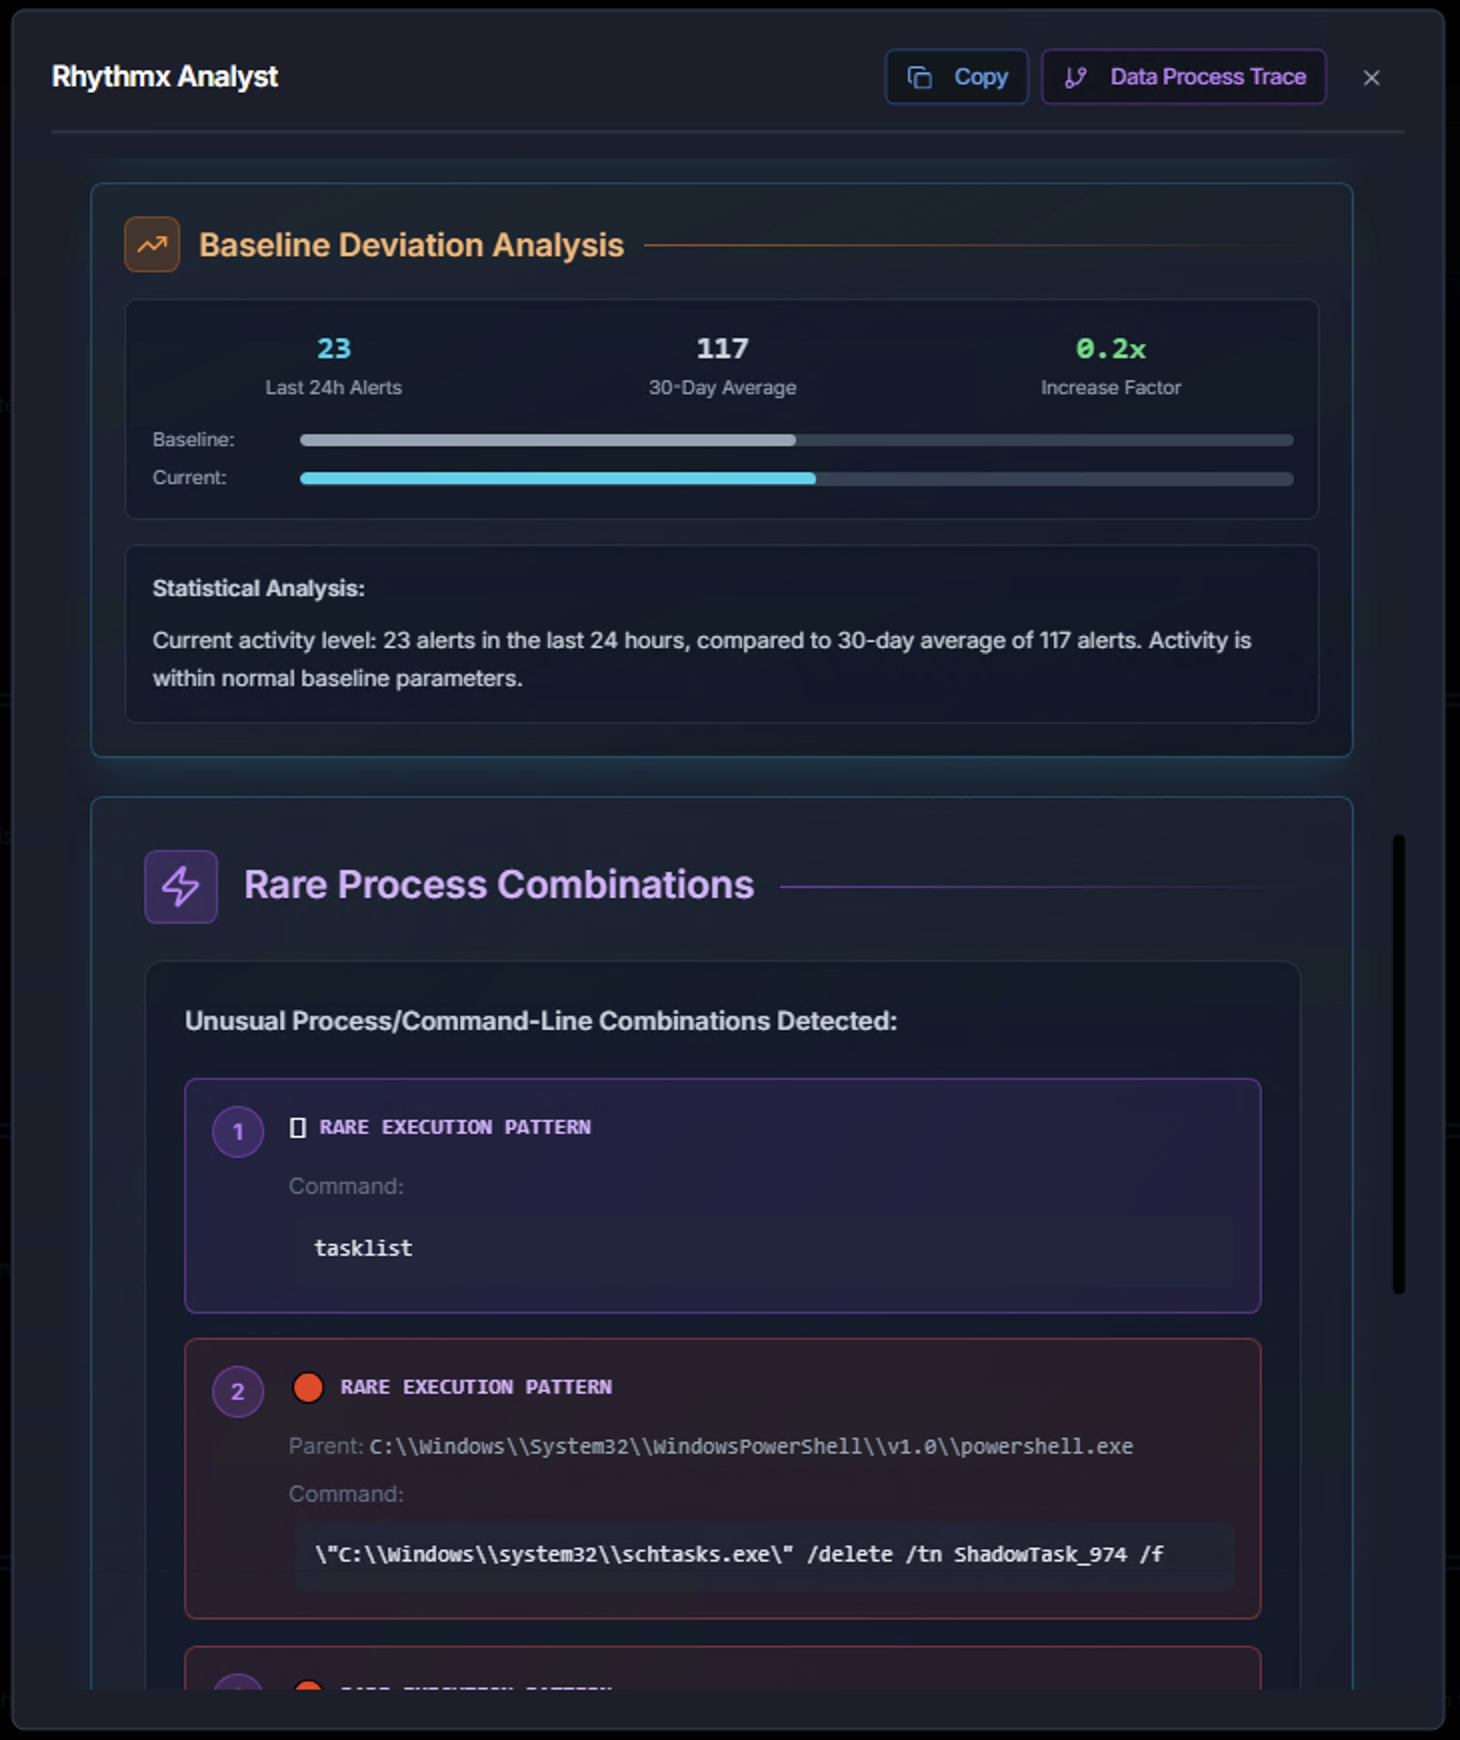
The AI analyst includes a Baseline Deviation Analysis that compares the entity's current activity against its historical norm:
- Last 24h Alerts — Alert count in the most recent 24-hour period
- 30-Day Average — The entity's typical alert volume over 30 days
- Increase Factor — How much current activity deviates from the baseline (e.g., 0.2x means activity is below average, 5x means activity is five times the norm)
Below the baseline analysis, the AI identifies Rare Process Combinations — command-line patterns that have been observed very few times or only once. These are highlighted because:
- A process that has only been seen once is statistically rare and potentially suspicious
- Unusual command-line arguments often indicate adversary tooling or living-off-the-land techniques
- Rare combinations of parent-child process relationships can reveal execution chains
Rare Execution Patterns
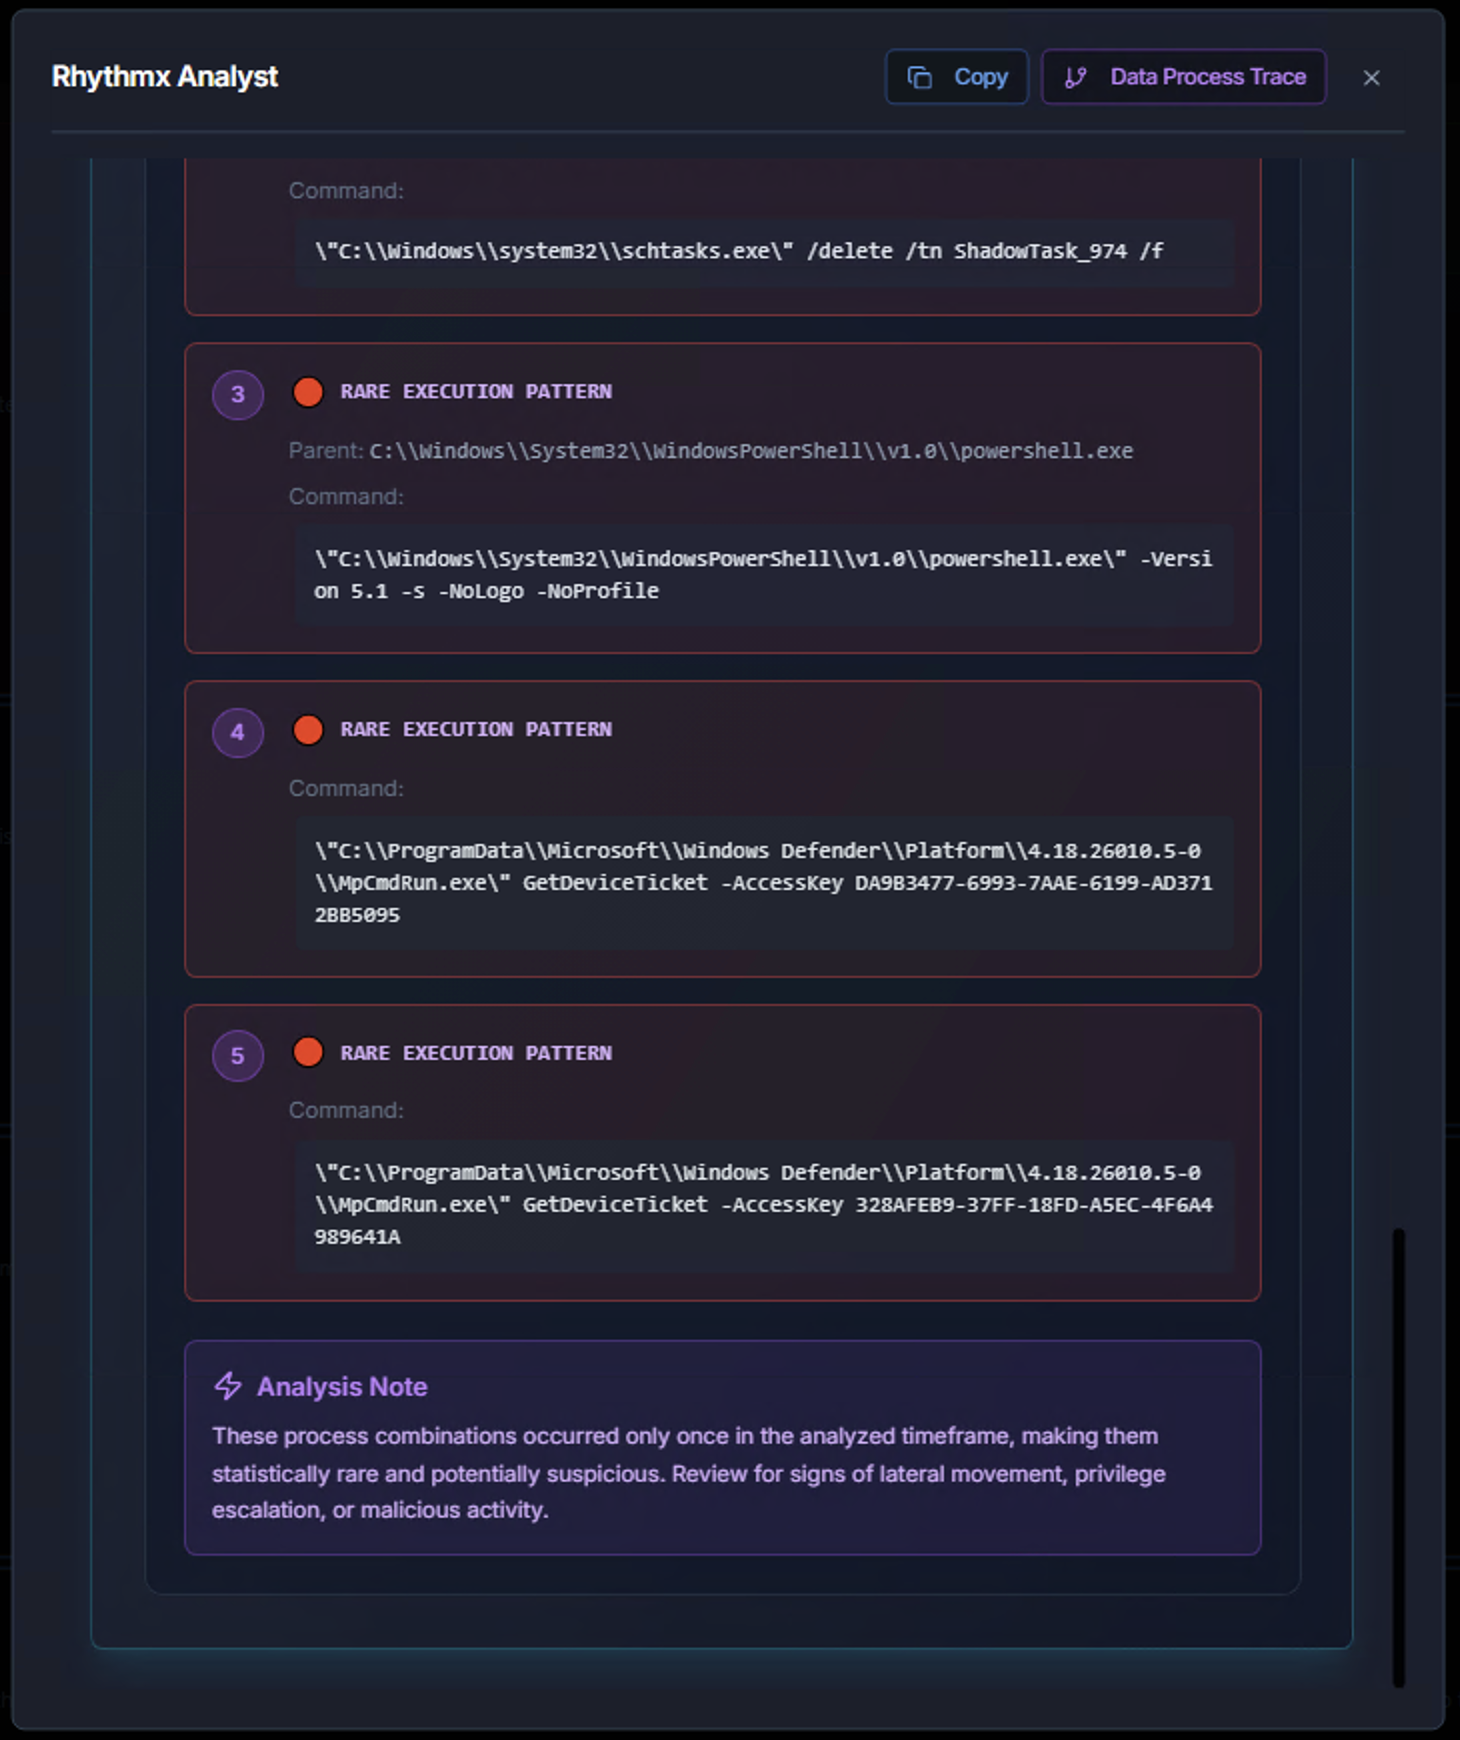
Each rare execution pattern shows:
- Pattern number and severity indicator — Ranked by suspicion level
- Parent process — What launched the command
- Command — The exact command-line that was executed
The Analysis Note at the bottom summarizes the overall significance — for example, whether the rare combinations suggest lateral movement, privilege escalation, or malicious activity that warrants deeper investigation.
Using the AI Results
The AI results include Copy and Data Process Trace buttons:
| Button | Purpose |
|---|---|
| Copy | Copy the full analysis to clipboard for pasting into case notes or ticketing systems |
| Data Process Trace | View the underlying data flow and processing steps the AI used to reach its conclusions — useful for validating the analysis |
User Investigation
The investigation workflow also applies to user entities. When you click on a user from the High-Risk Origin Account, High-Risk Impact Account, or High-Risk Privileged Account panels, you see the same timeline and drill-down capabilities — plus additional user-specific context.
User Timeline
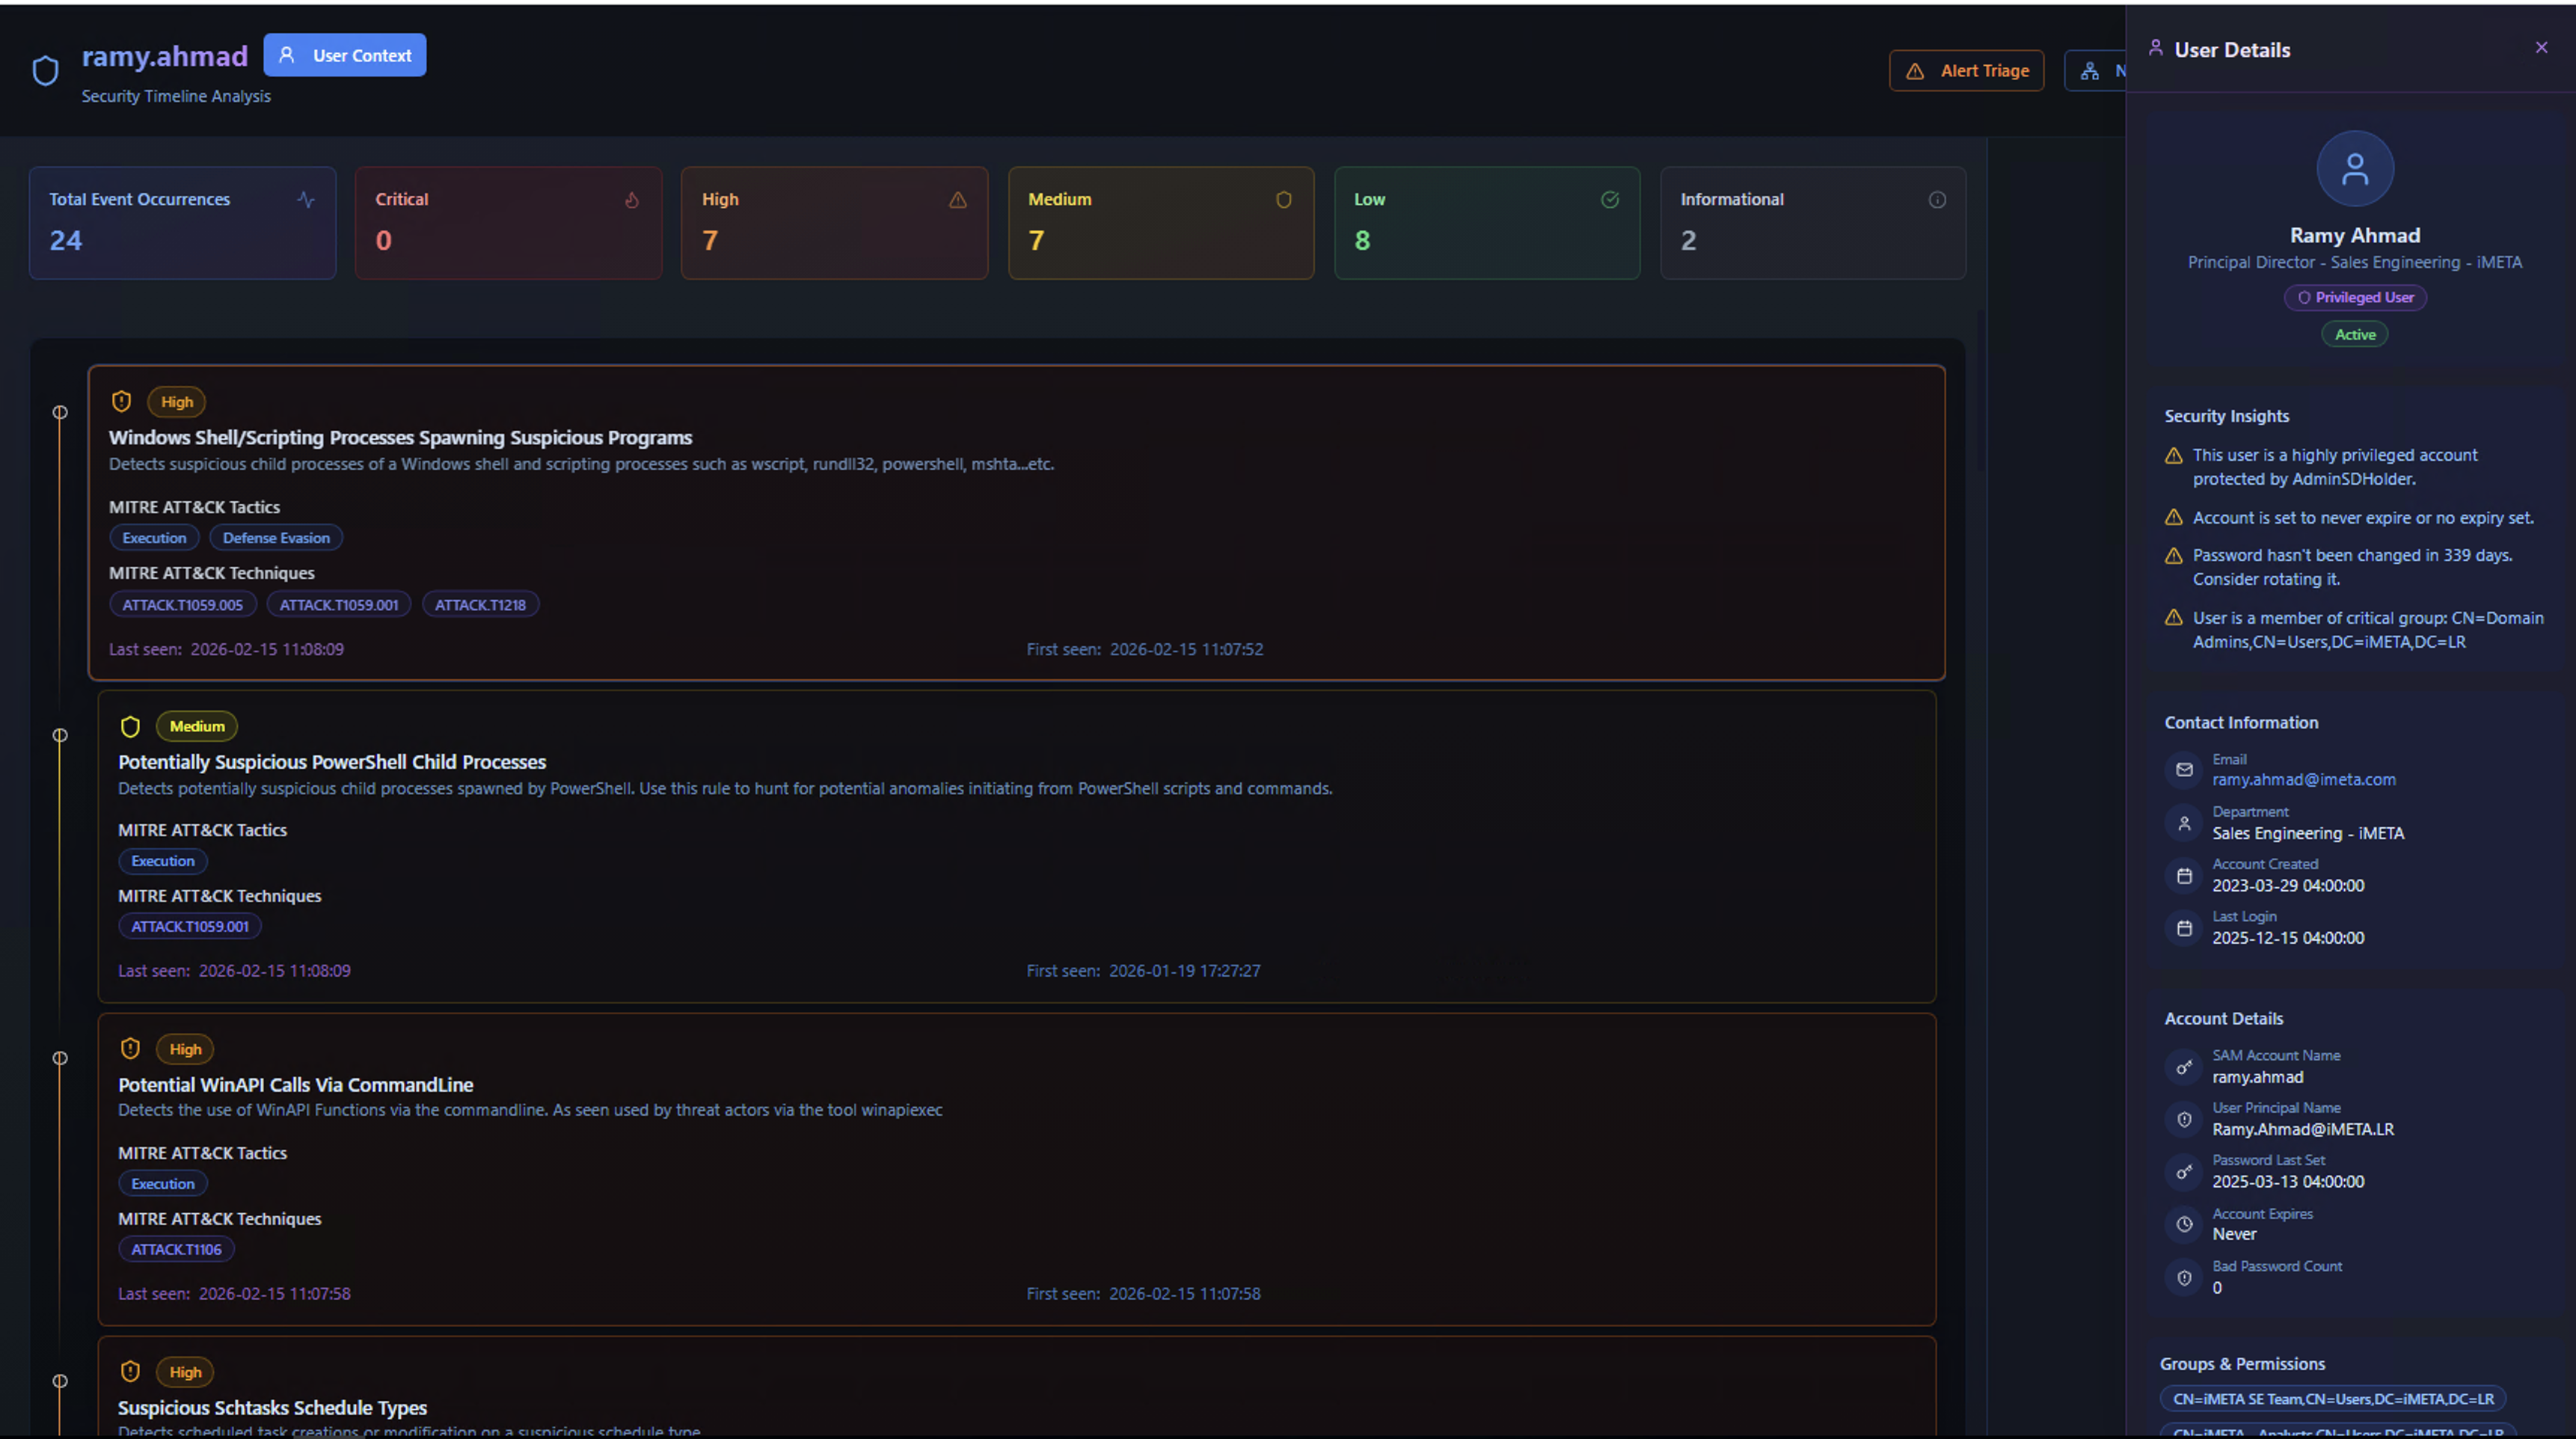
The user timeline shows all detection activity associated with a specific user account. The User Details panel on the right provides identity context alongside the alert timeline.
User Details Panel
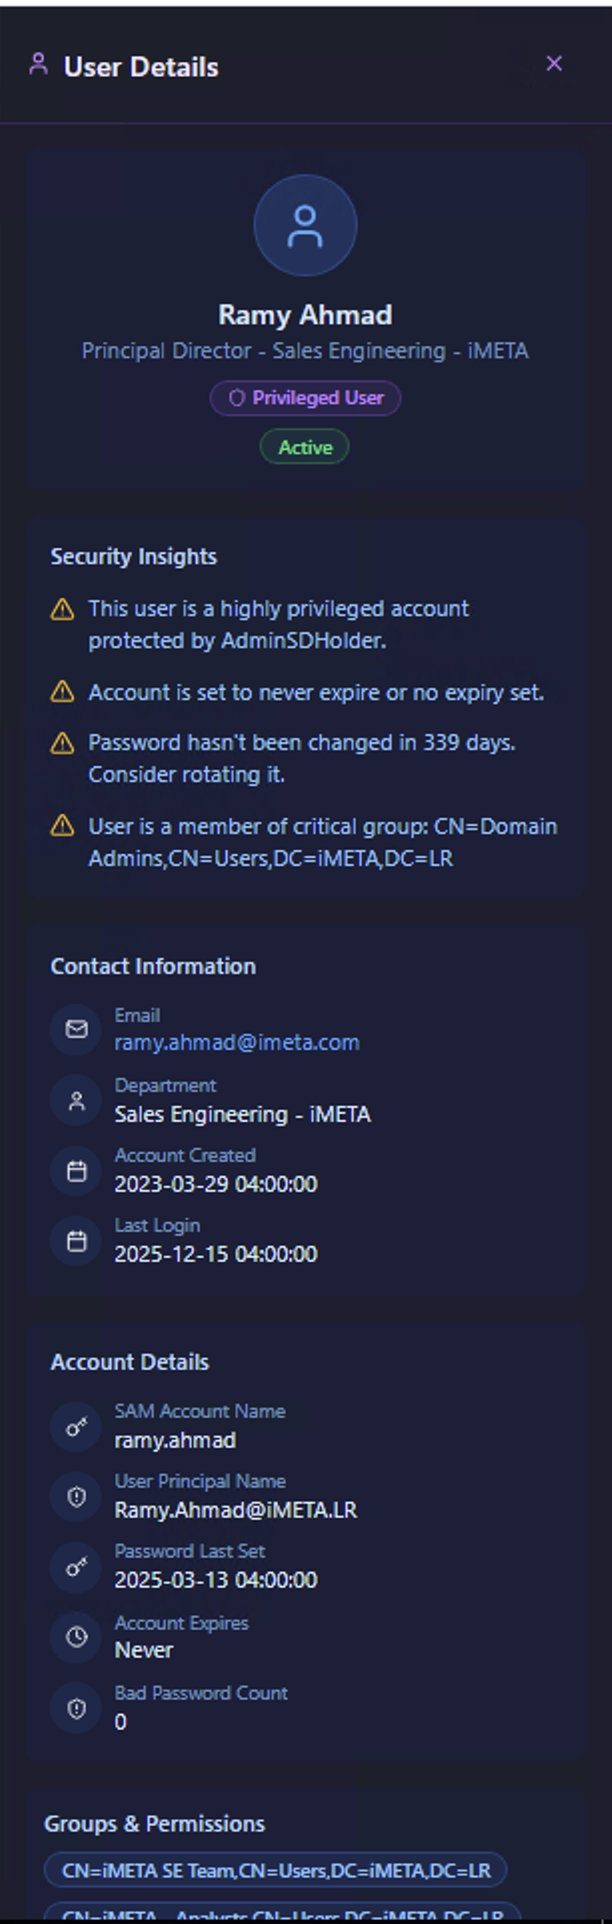
The User Details panel enriches the investigation with identity information pulled from LDAP/Active Directory:
| Section | What It Shows |
|---|---|
| Identity | User name, title, department, and organizational role |
| Privileged User badge | Whether the account has elevated privileges — privileged accounts require higher scrutiny |
| Account Status | Active or disabled status |
| Security Insights | Key risk indicators — e.g., "This user is a highly privileged account", "Password hasn't been changed in X days", "Member of critical security group" |
| Contact Information | Email, department, and organizational unit |
| Account Details | SAM account name, user principal name, account creation date, last logon, password last set, account expiration, and bad password count |
| Groups & Permissions | Active Directory group memberships — critical for understanding what the account has access to |
Why user context matters: An alert on a regular user account is very different from the same alert on a Domain Admin. The User Details panel gives analysts the context to prioritize based on the impact potential of the compromised account, not just the alert severity.
Investigation Workflow Summary
The complete investigation flow follows this path:
flowchart TD
    A[Security Dashboard<br><b>ML-Detected High-Risk Entity</b>] --> B[Security Timeline Analysis<br><b>Entity KPIs + Alert Cards</b>]
    B --> C[Event Details<br><b>Individual Occurrences</b>]
    C --> D[Alert Detail Panel<br><b>Risk, Context, Process, MITRE</b>]
    B --> E[Network Graph<br><b>Entity Relationships</b>]
    E --> F[Node Details<br><b>Connection-Level Analysis</b>]
    B --> G[AI Alert Triage<br><b>Automated Threat Analysis</b>]
    G --> H[AI Results<br><b>Findings, Actions, Patterns</b>]
B --> I[User Details<br><b>Identity + LDAP Context</b>]| Step | What the Analyst Does | Key Decision |
|---|---|---|
| 1. Dashboard | Identify ML-flagged high-risk entity | Which entity to investigate first? |
| 2. Timeline | Review severity breakdown and alert cards | What types of attacks are occurring? |
| 3. Event Details | Examine individual alert occurrences | Is this persistent or a one-time event? |
| 4. Detail Panel | Analyze process chains, command lines, and context | Is this legitimate or malicious? |
| 5. Network Graph | Map entity relationships and lateral movement | How far has the activity spread? |
| 6. AI Triage | Get automated analysis and recommended actions | What should I do next? |
Once the investigation is complete, use Generate Report to export findings. See Reporting for details.