RhythmX Hunt
RhythmX Hunt is the direct log exploration and hypothesis-driven threat hunting interface. It provides real-time search across billions of indexed log events using a powerful query language, interactive timeline visualization, customizable analytics widgets, and saved query dashboards.
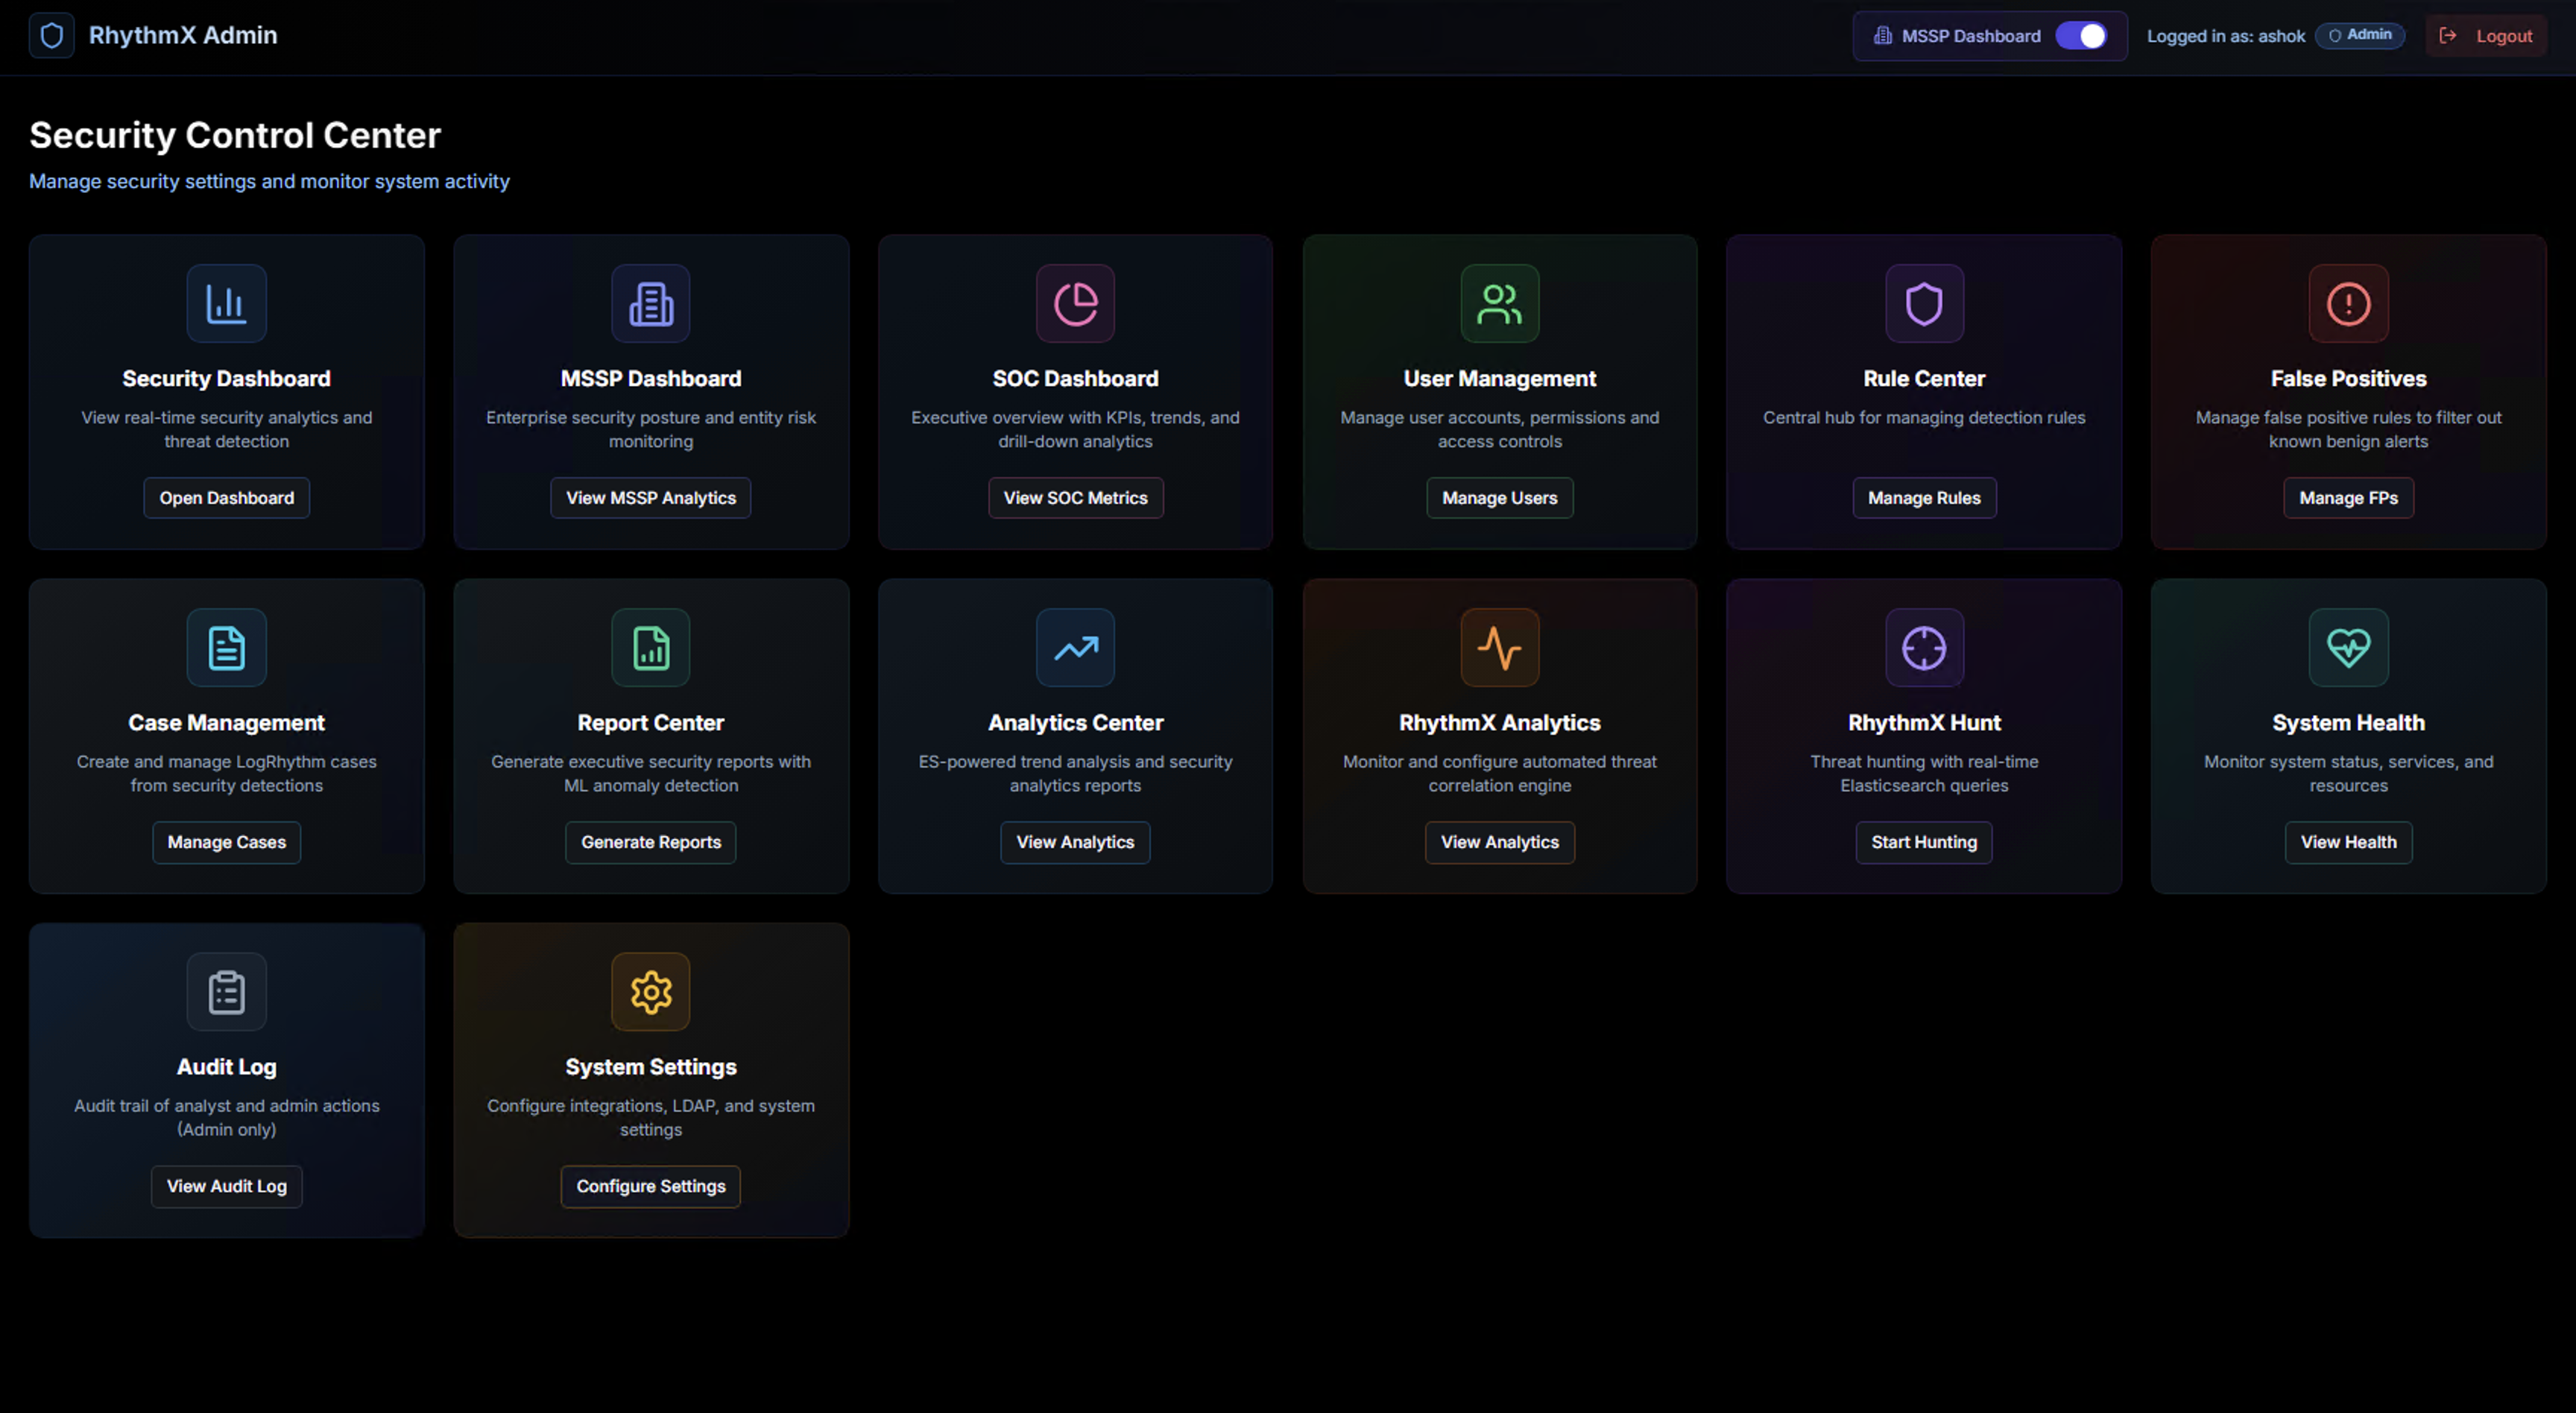
From the Security Control Center, click Start Hunting on the RhythmX Hunt widget.
Hunt Interface Overview
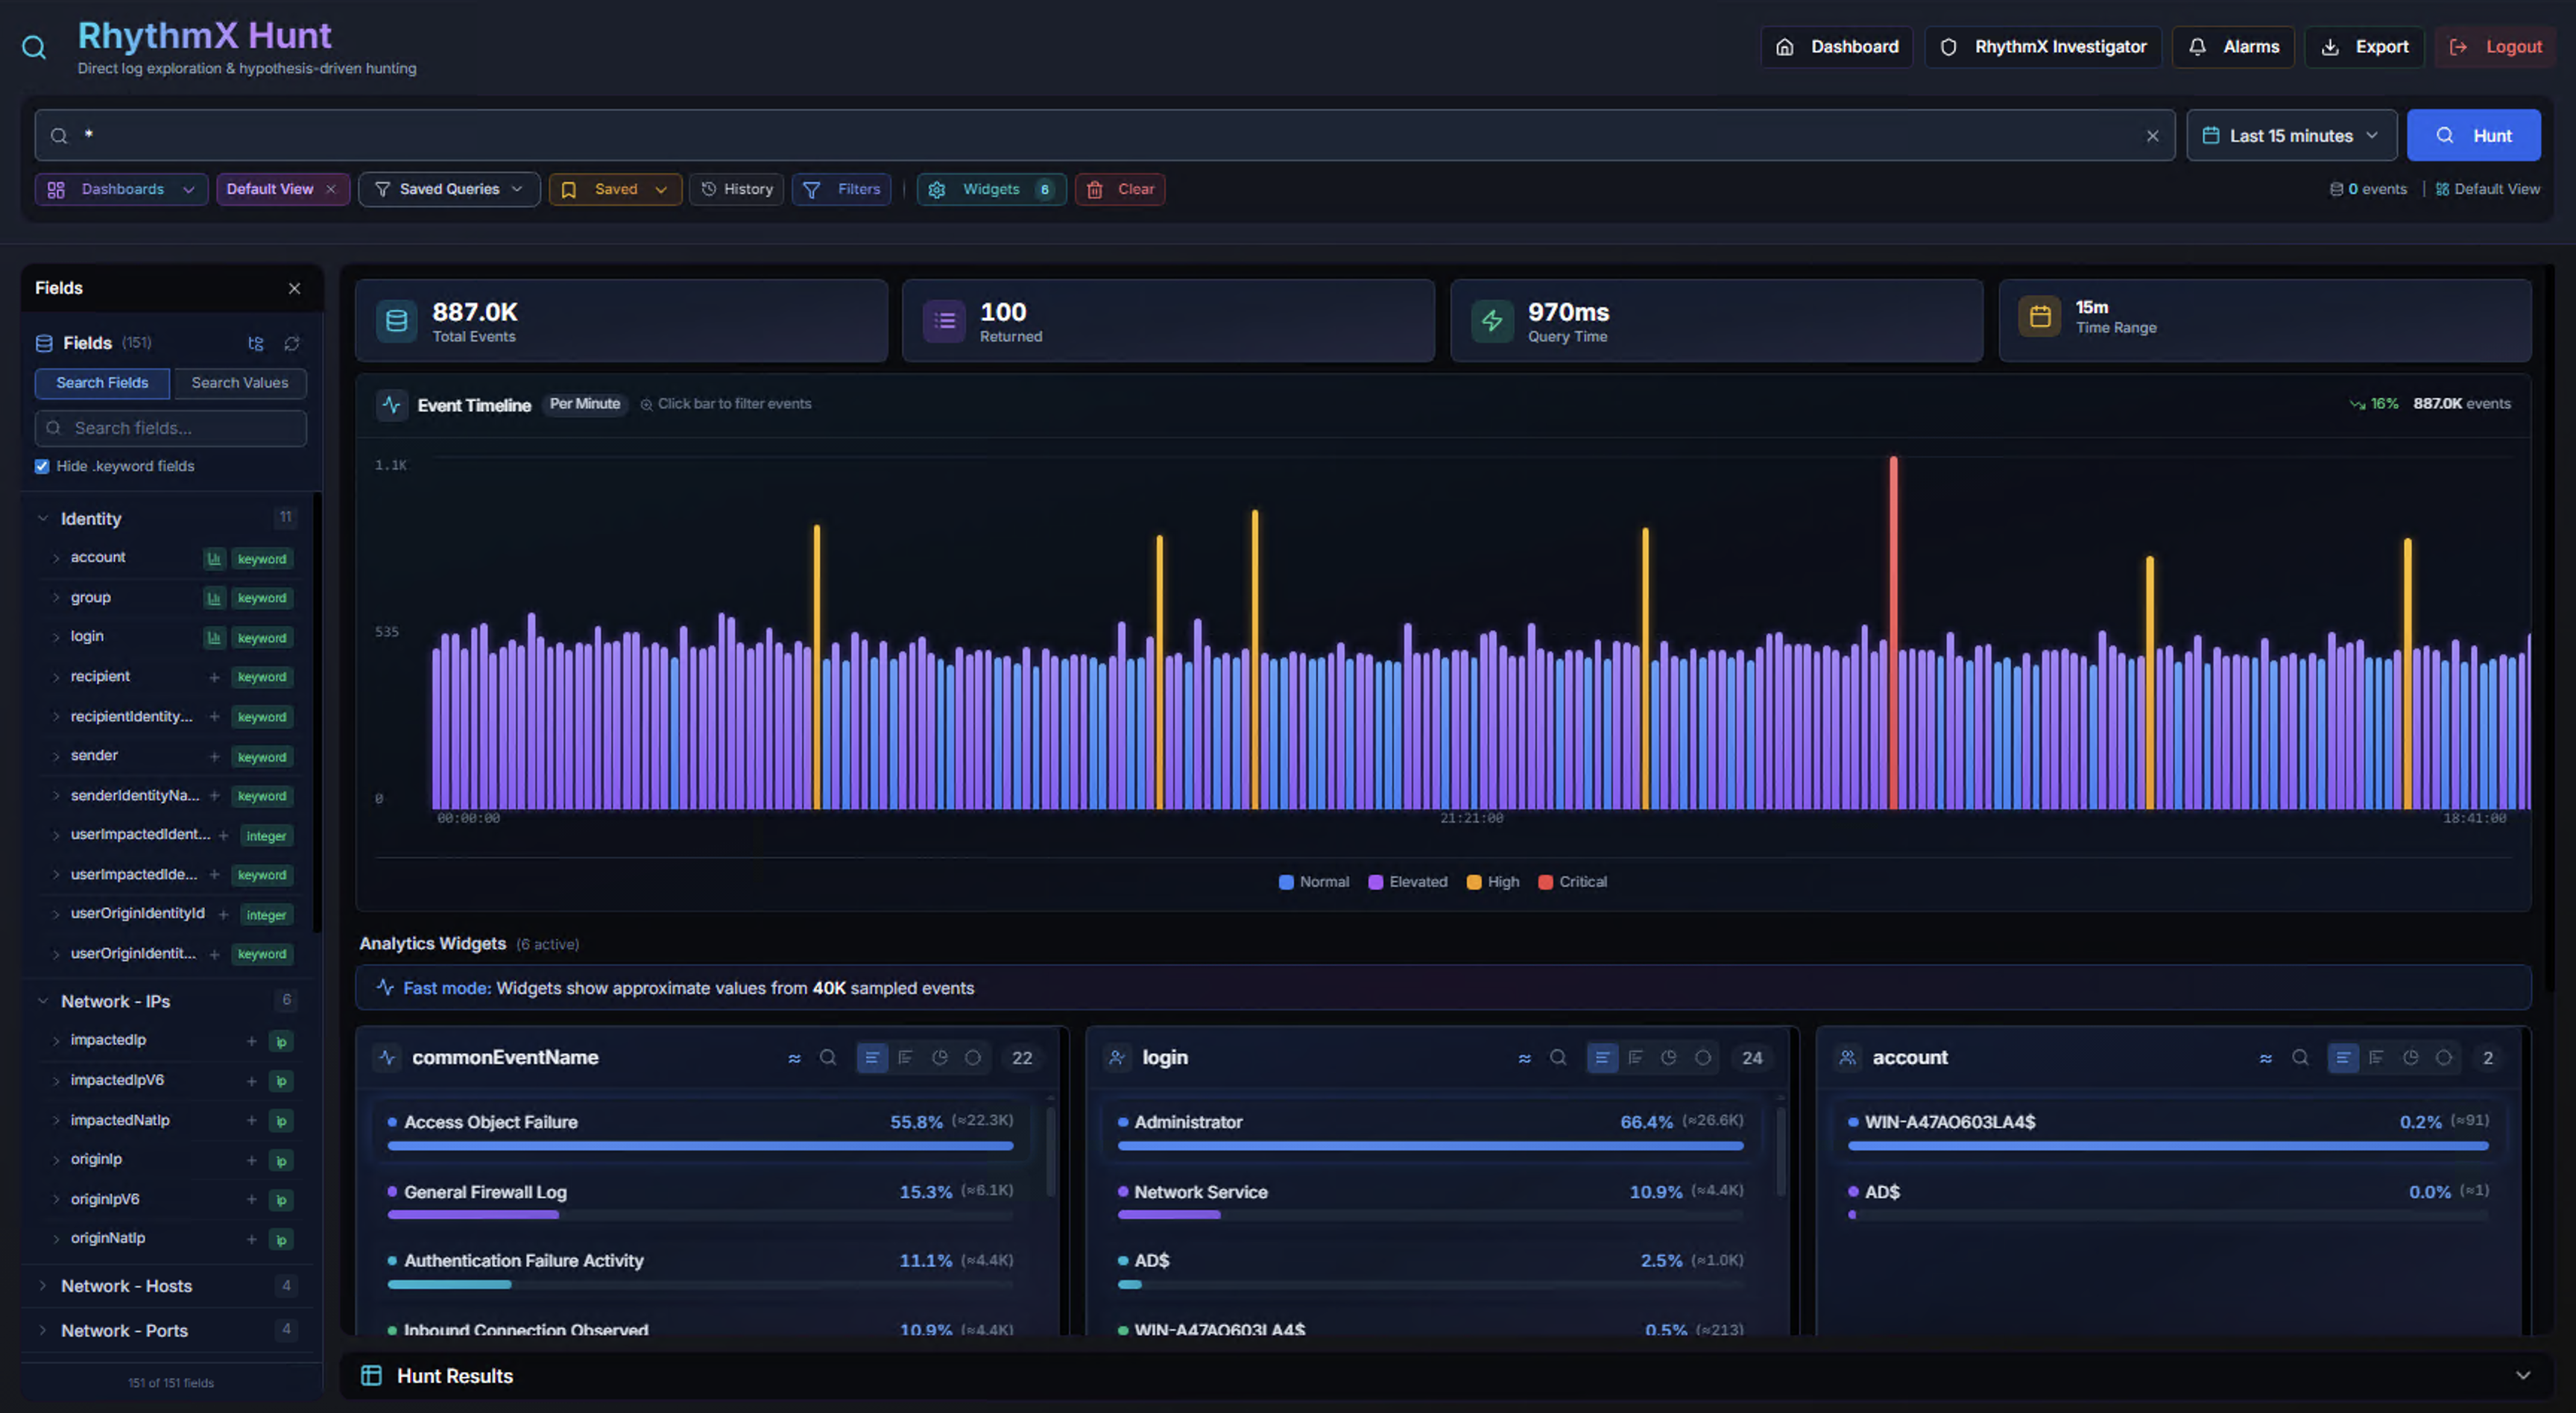
The Hunt page is organized into the following areas:
| Area | Description |
|---|---|
| Search Bar | Query input with autocomplete, field suggestions, and recent search history |
| KPIs | Total events, sources returned, query time, and active time range |
| Event Timeline | Color-coded bar chart of event volume over time with drill-down |
| Fields Panel | Left sidebar listing all searchable fields grouped by category |
| Analytics Widgets | Configurable breakdown charts for key fields |
| Hunt Results | Paginated event table with full event detail panel |
The top navigation bar provides quick links to Dashboard, RhythmX Investigation, Alarms, and Export.
Search Bar
Query Syntax
RhythmX Hunt supports a powerful query language with field-based search, wildcards, boolean operators, and grouping.
Field-Based Search:
| Syntax | Example | Description |
|---|---|---|
field:value |
login:admin |
Exact field match |
field:value* |
login:admin* |
Wildcard — starts with |
field:*value* |
login:*admin* |
Wildcard — contains |
field:value? |
status:0xc00000?a |
Single character wildcard |
| Plain text | powershell |
Free-text search across log messages |
Boolean Operators:
| Operator | Example | Description |
|---|---|---|
AND |
login:admin AND event_id:4625 |
Both conditions must match |
OR |
login:admin OR login:root |
Either condition matches |
NOT |
NOT event_id:4624 |
Exclude matching events |
-field:value |
-login:system |
Shorthand for NOT |
| Parentheses | (login:admin OR login:root) AND event_id:4625 |
Group conditions |
Special Handling:
- IP wildcards are supported (e.g.,
src_ip:192.168.*matches all IPs in that subnet) - Windows paths and command lines are detected and treated as literal searches
- Quoted values preserve spaces and special characters (e.g.,
command:"C:\Windows\System32\cmd.exe")
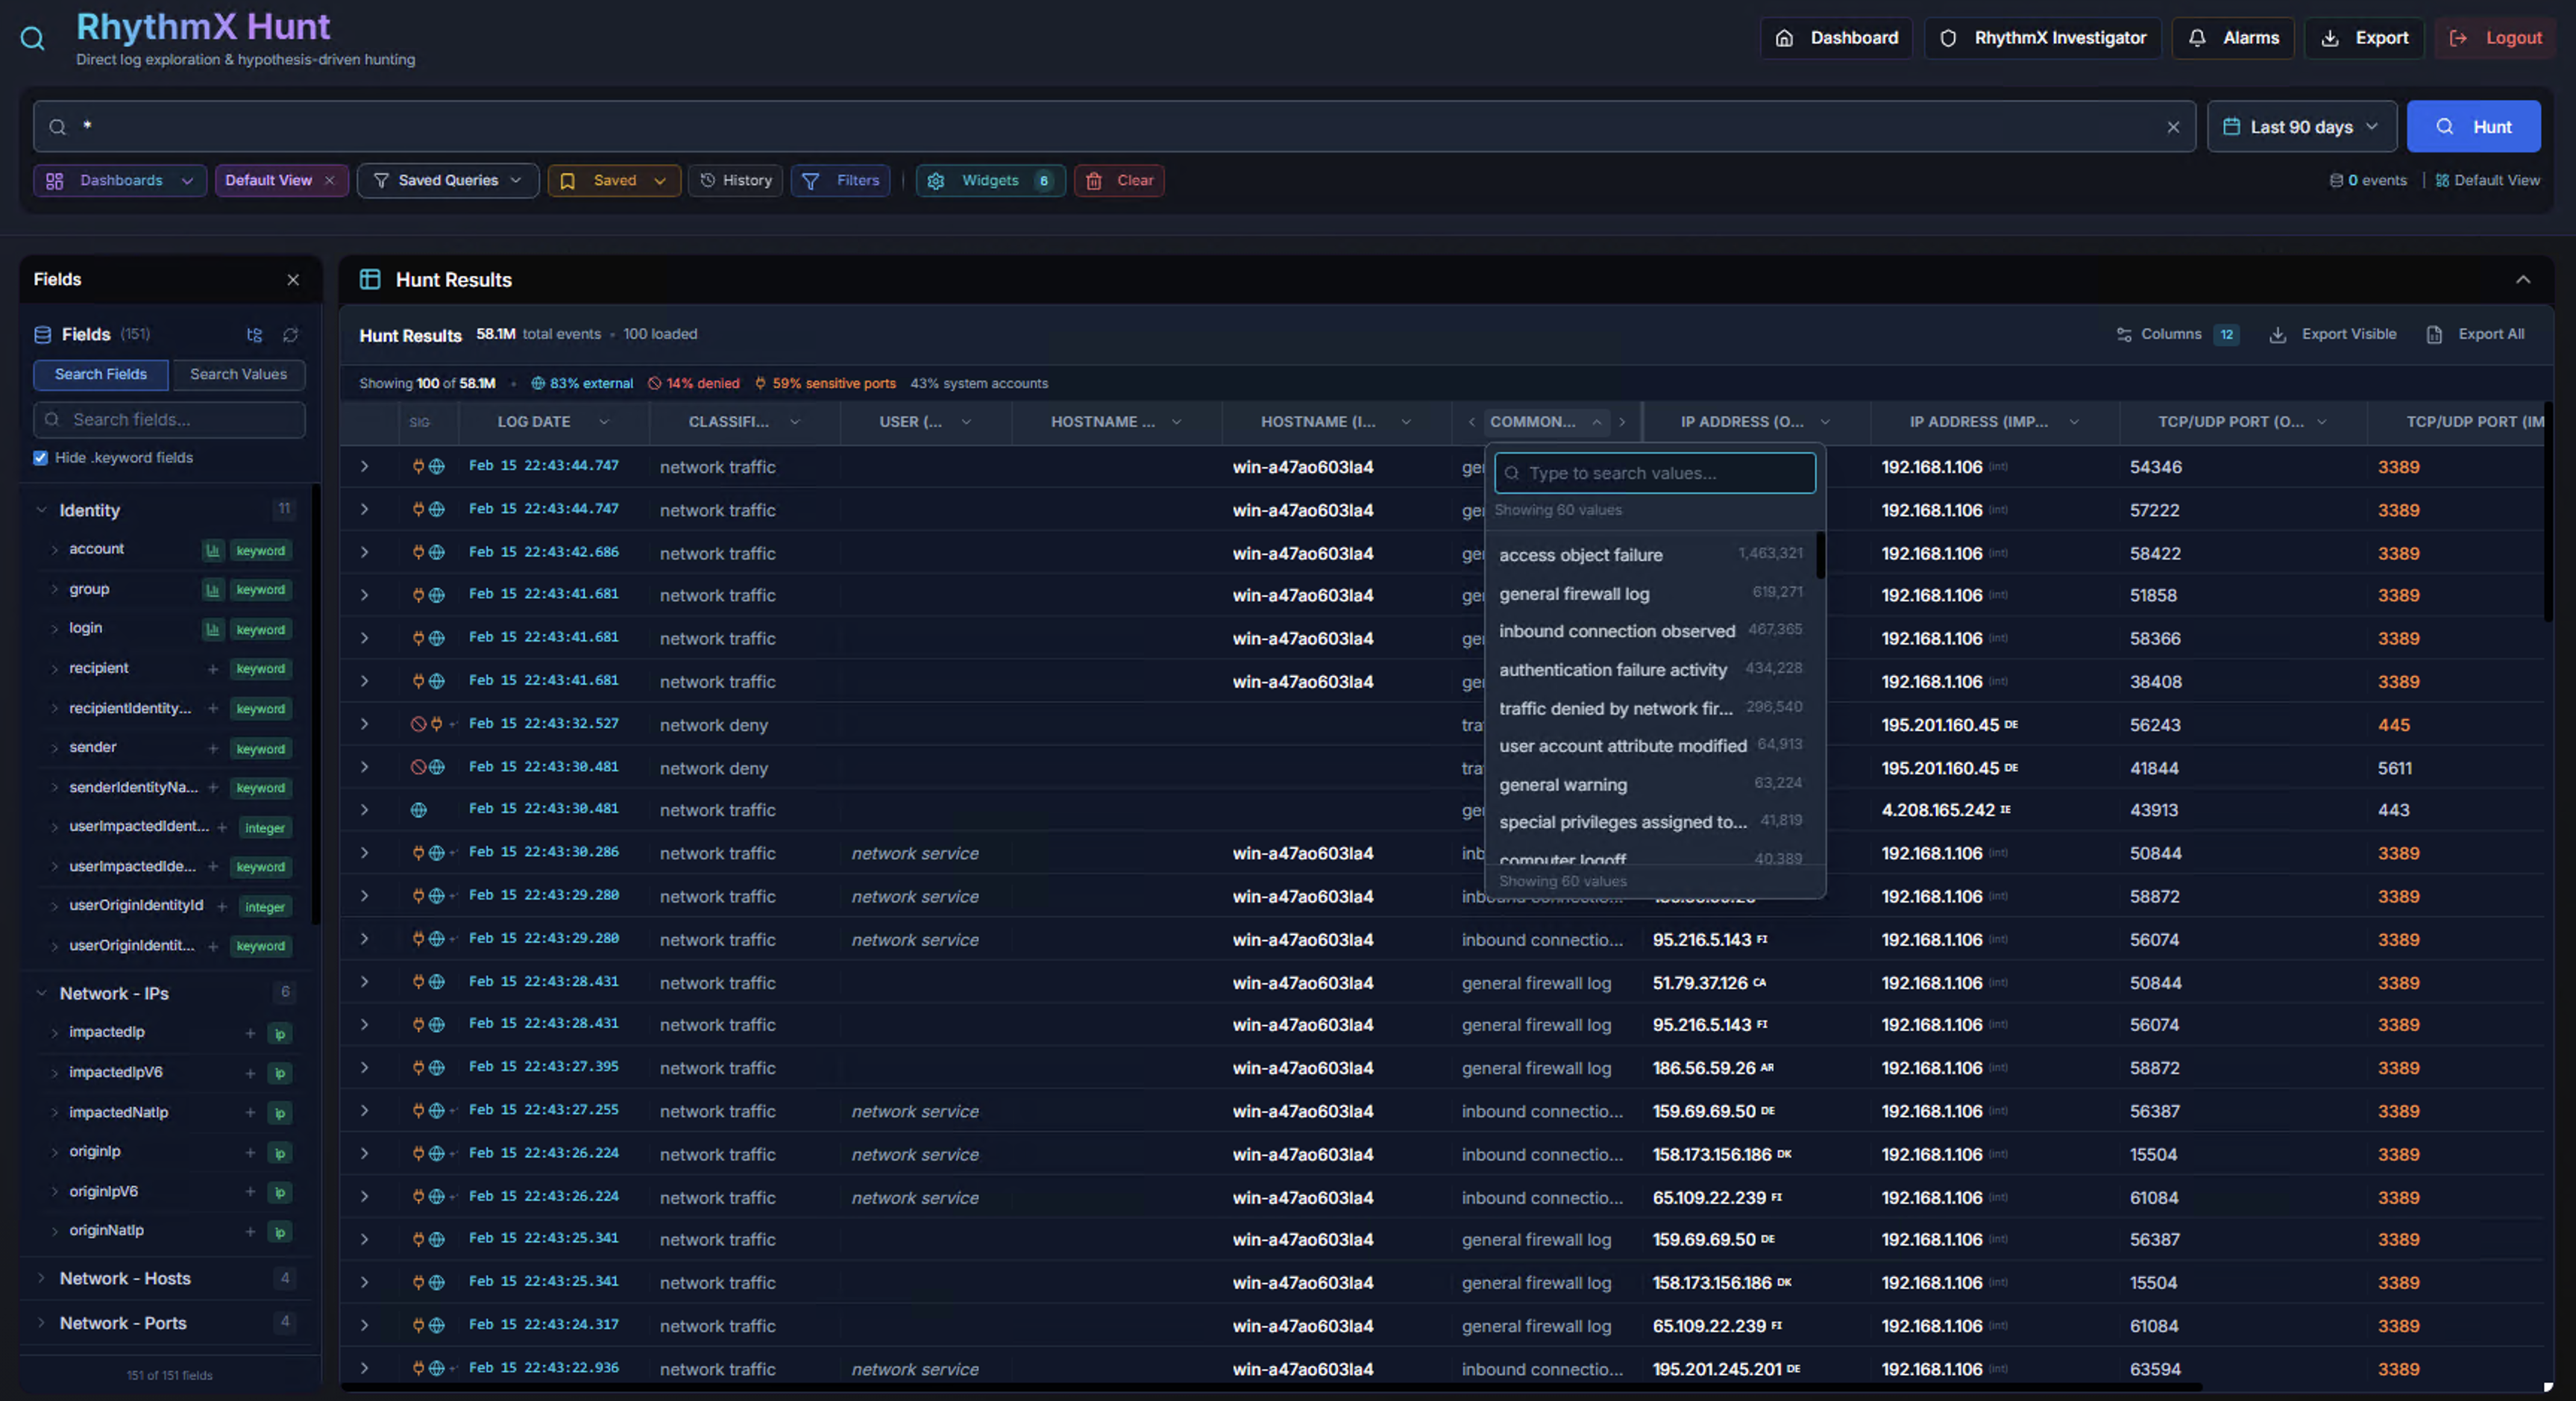
Autocomplete
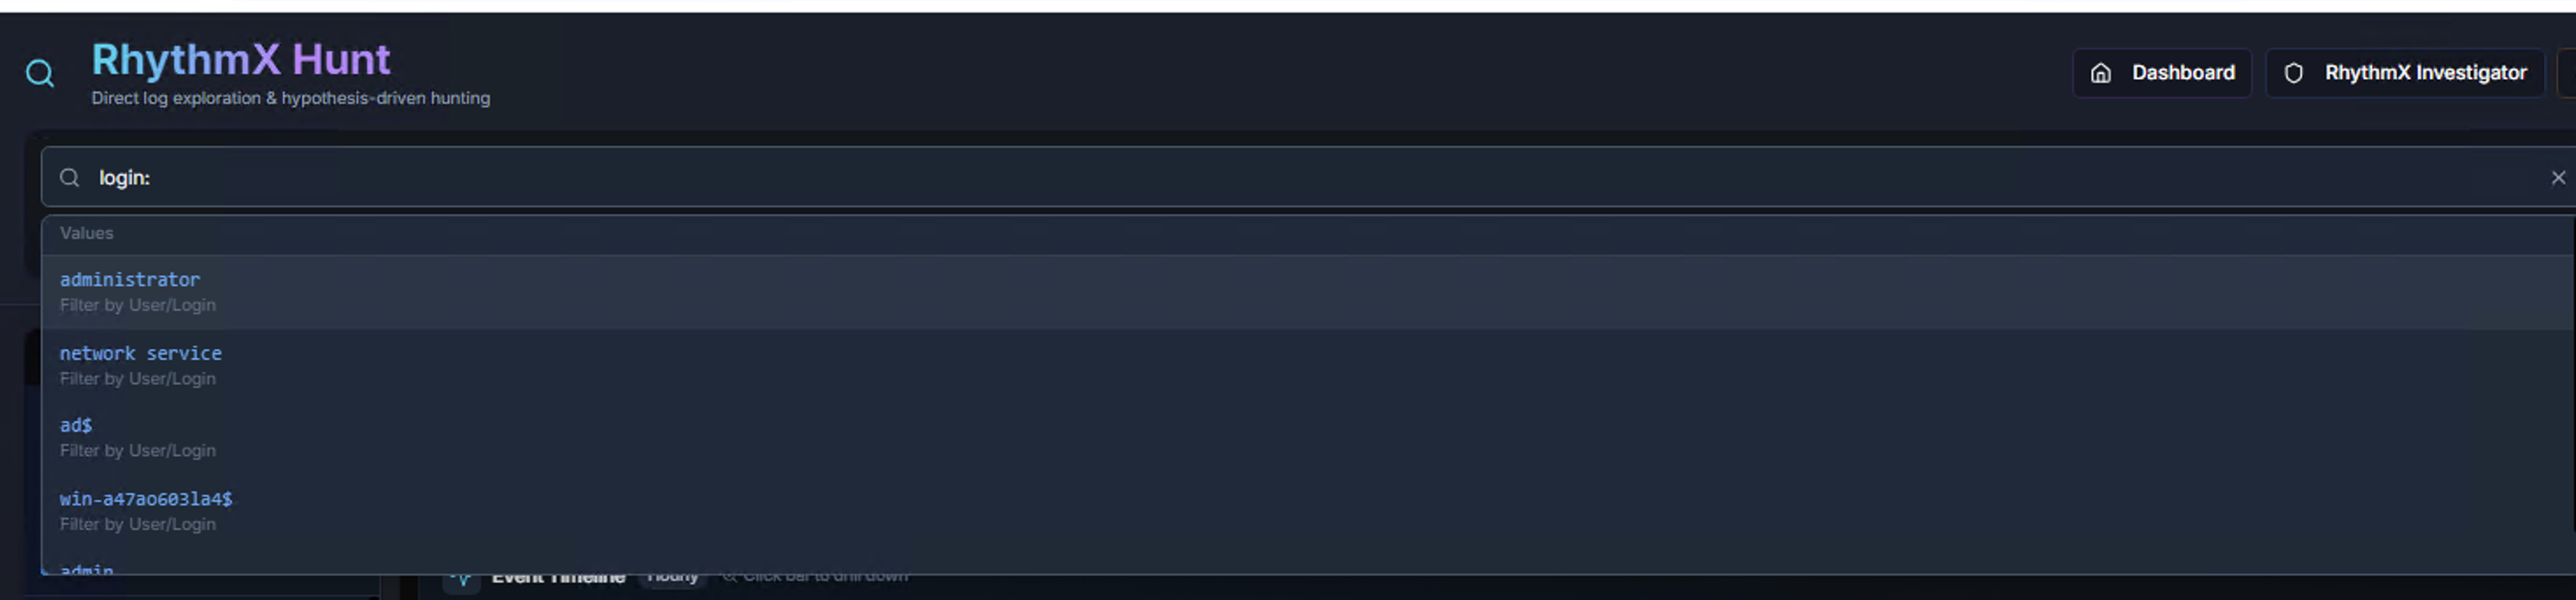
Type a field name followed by a colon (e.g., login:) to see suggested values from the current dataset. Each suggestion shows the field category (e.g., "Filter by User/Login").
Recent Searches
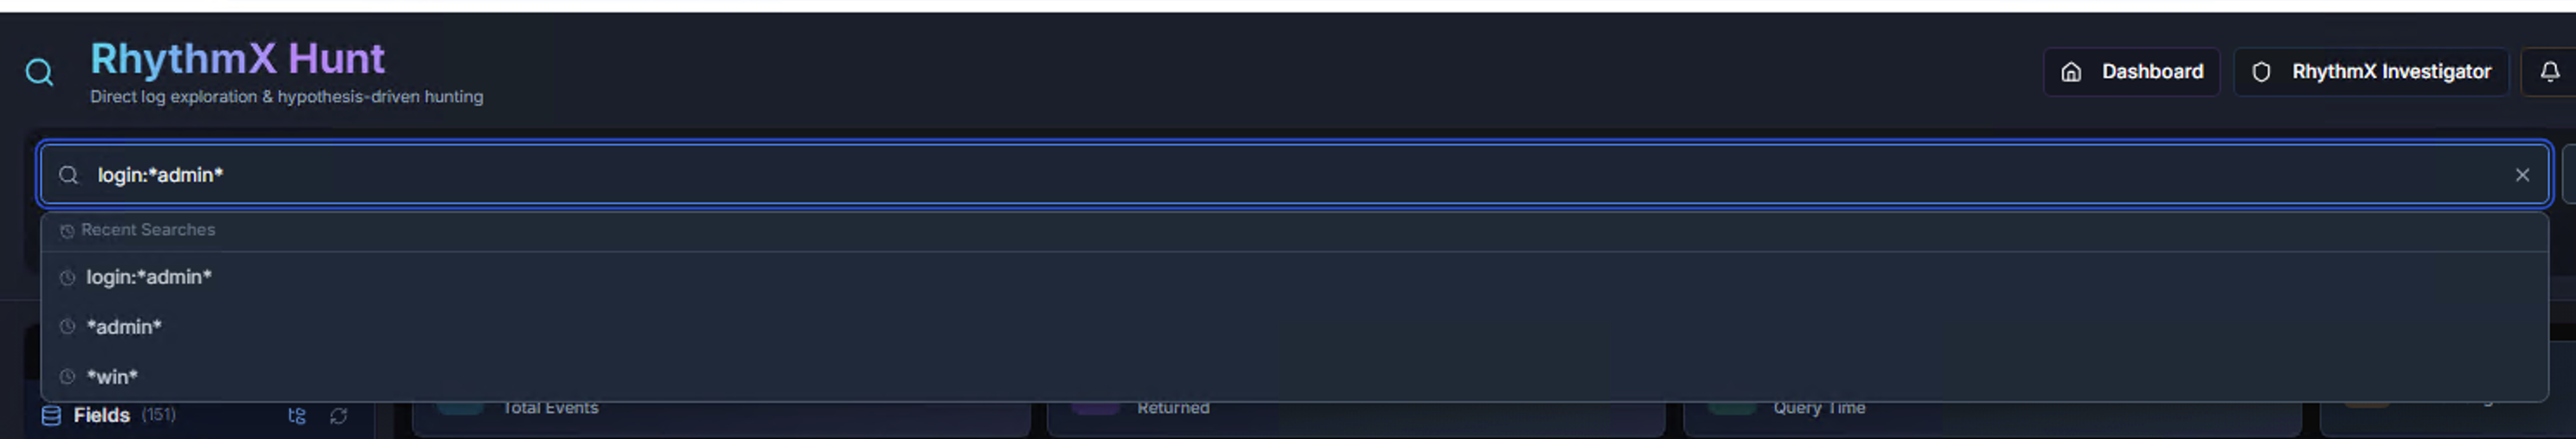
The search bar remembers recent queries. Start typing to see matching previous searches, including wildcard patterns.
Time Range
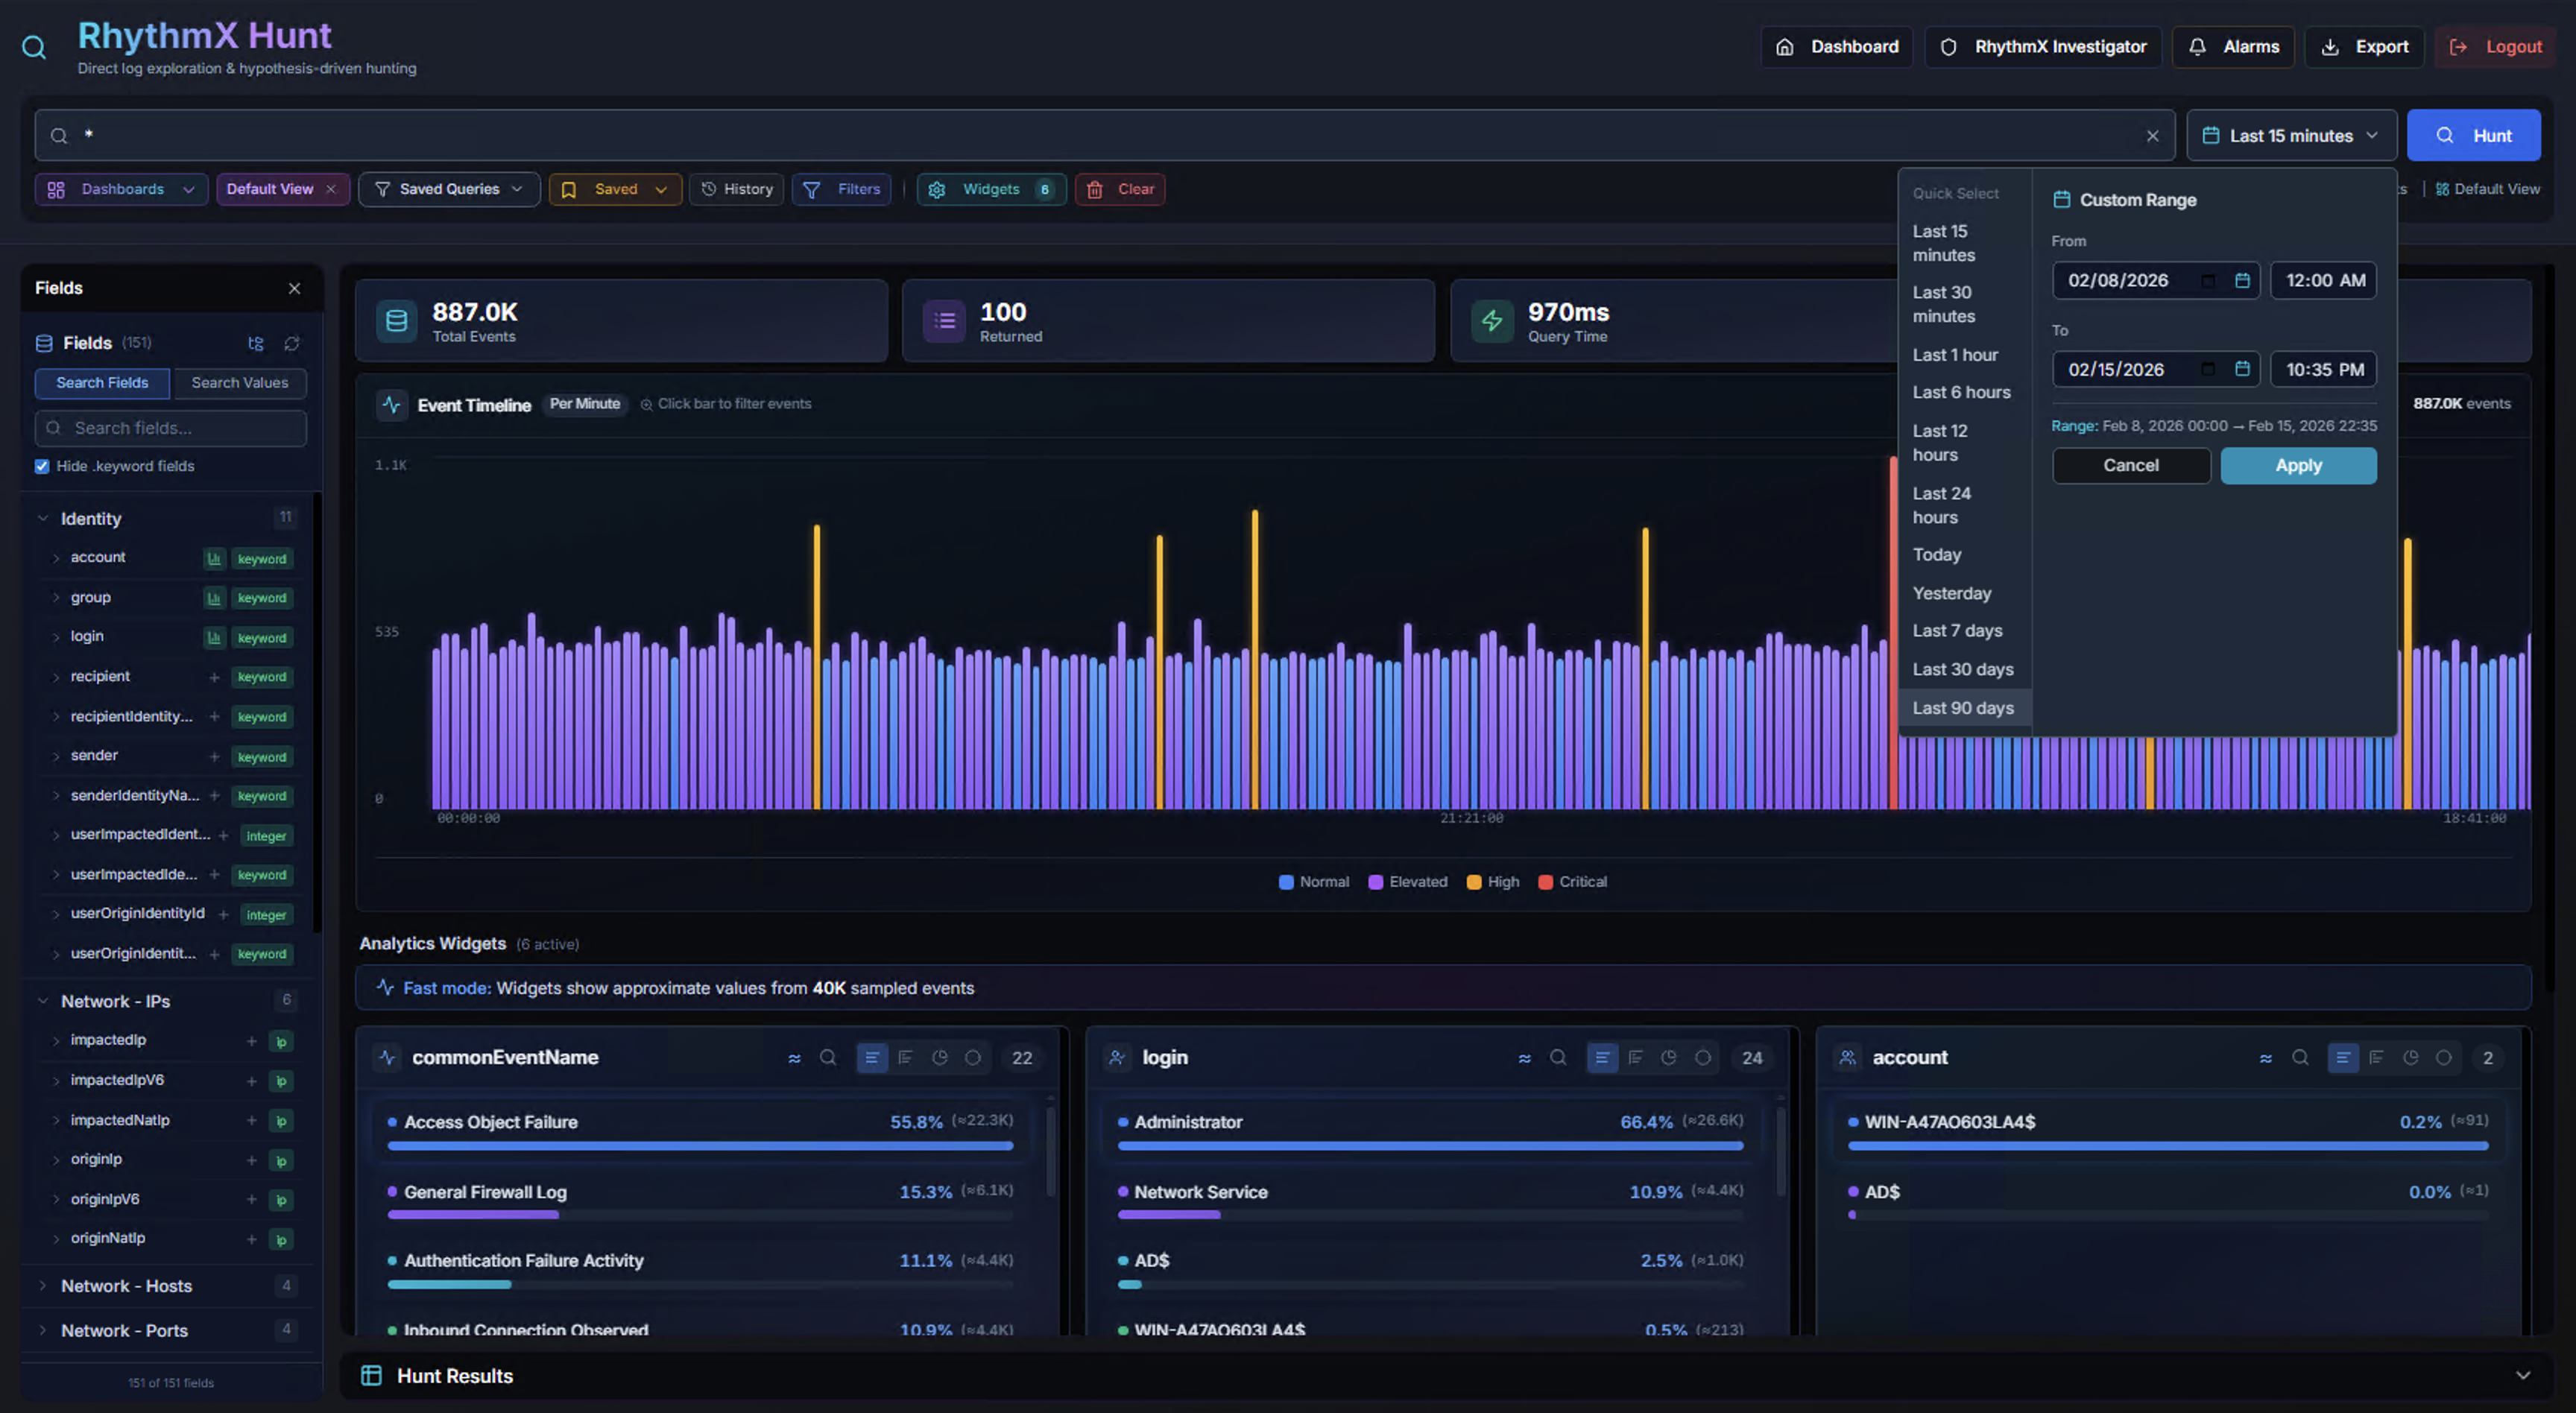
Click the time range selector in the top-right to choose the search window:
Preset Ranges:
| Range | Description |
|---|---|
| Last 1 Hour | Most recent hour of data |
| Last 8 Hours | Current shift window |
| Last 12 / 24 Hours | Half-day or full day |
| Today / Yesterday | Calendar day boundaries |
| Last 7 / 14 / 30 / 90 Days | Extended lookback periods |
Custom Range:
Select specific start and end dates with time pickers for precise investigation windows. Click Apply to execute the search.
Shorter time ranges return results faster as less data needs to be scanned.
KPIs
The KPI bar updates with every search:
| KPI | Description |
|---|---|
| Total Events | Total number of matching events across all indices (e.g., 887.0K, 58.1M) |
| Returned | Number of events loaded in the results table (max 100 per page) |
| Query Time | Elasticsearch query execution time in milliseconds |
| Time Range | The active date range for the current search |
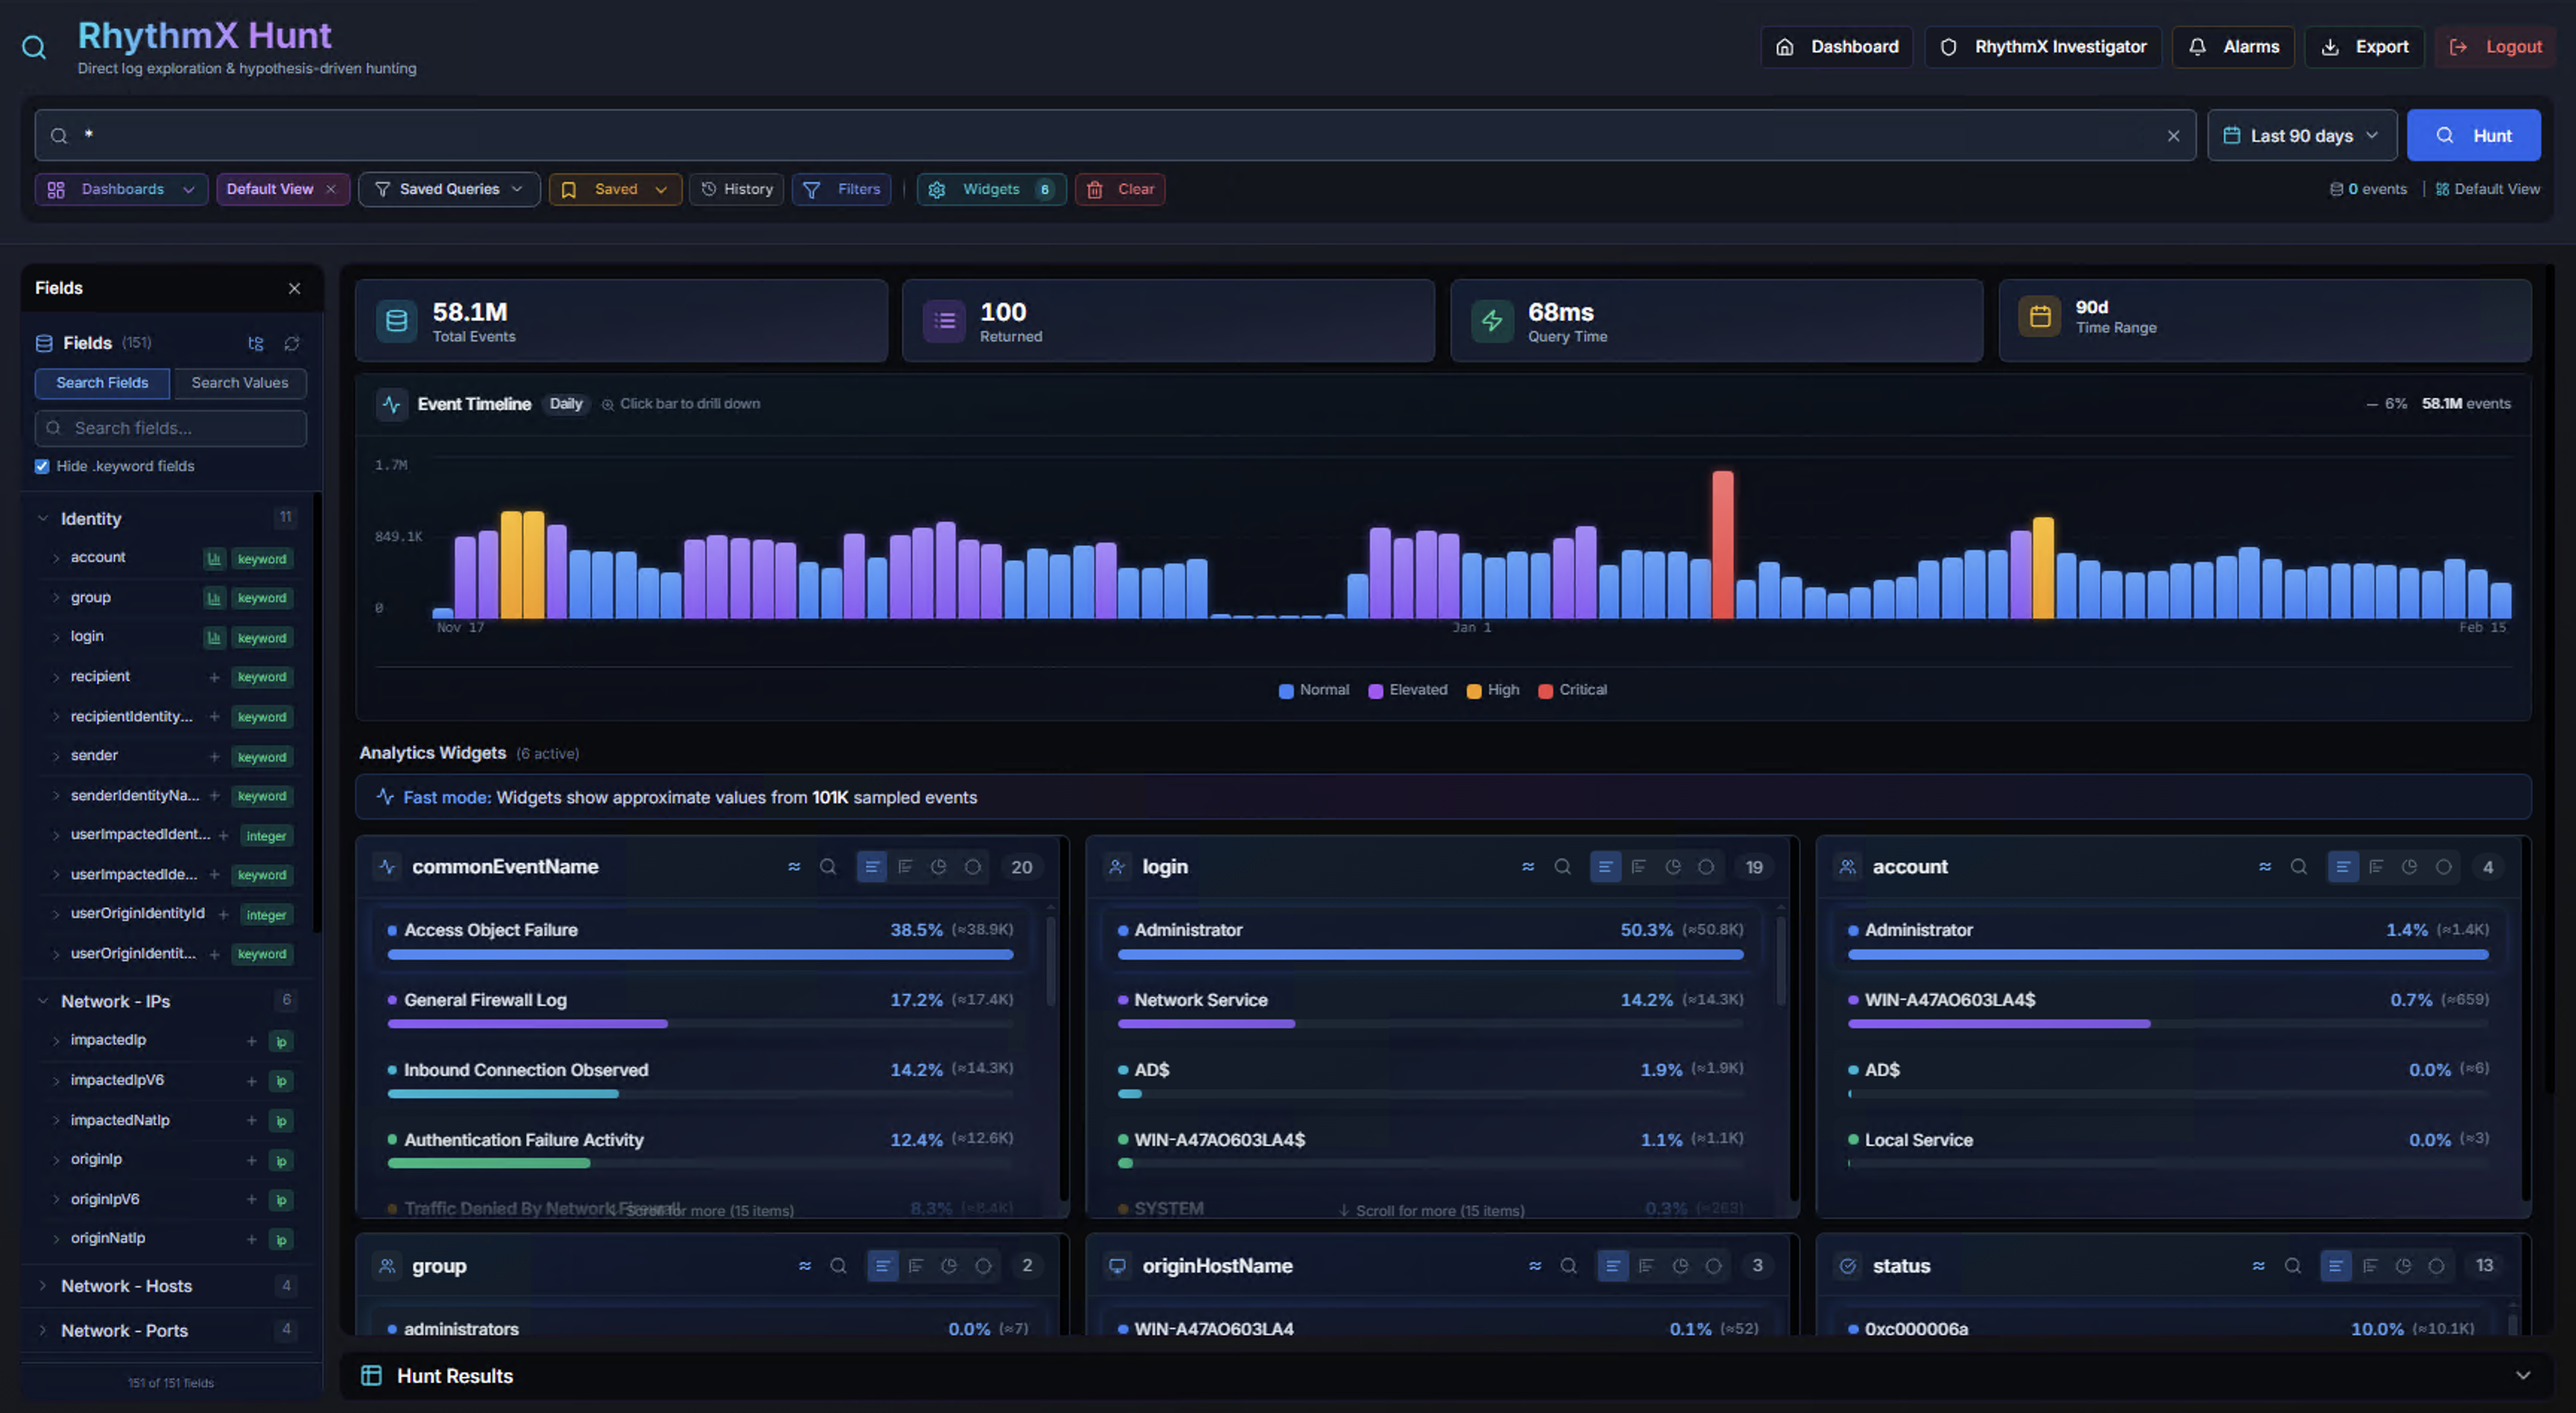
Longer time ranges query more data — a 90-day search can span tens of millions of events while still returning results in under 100ms.
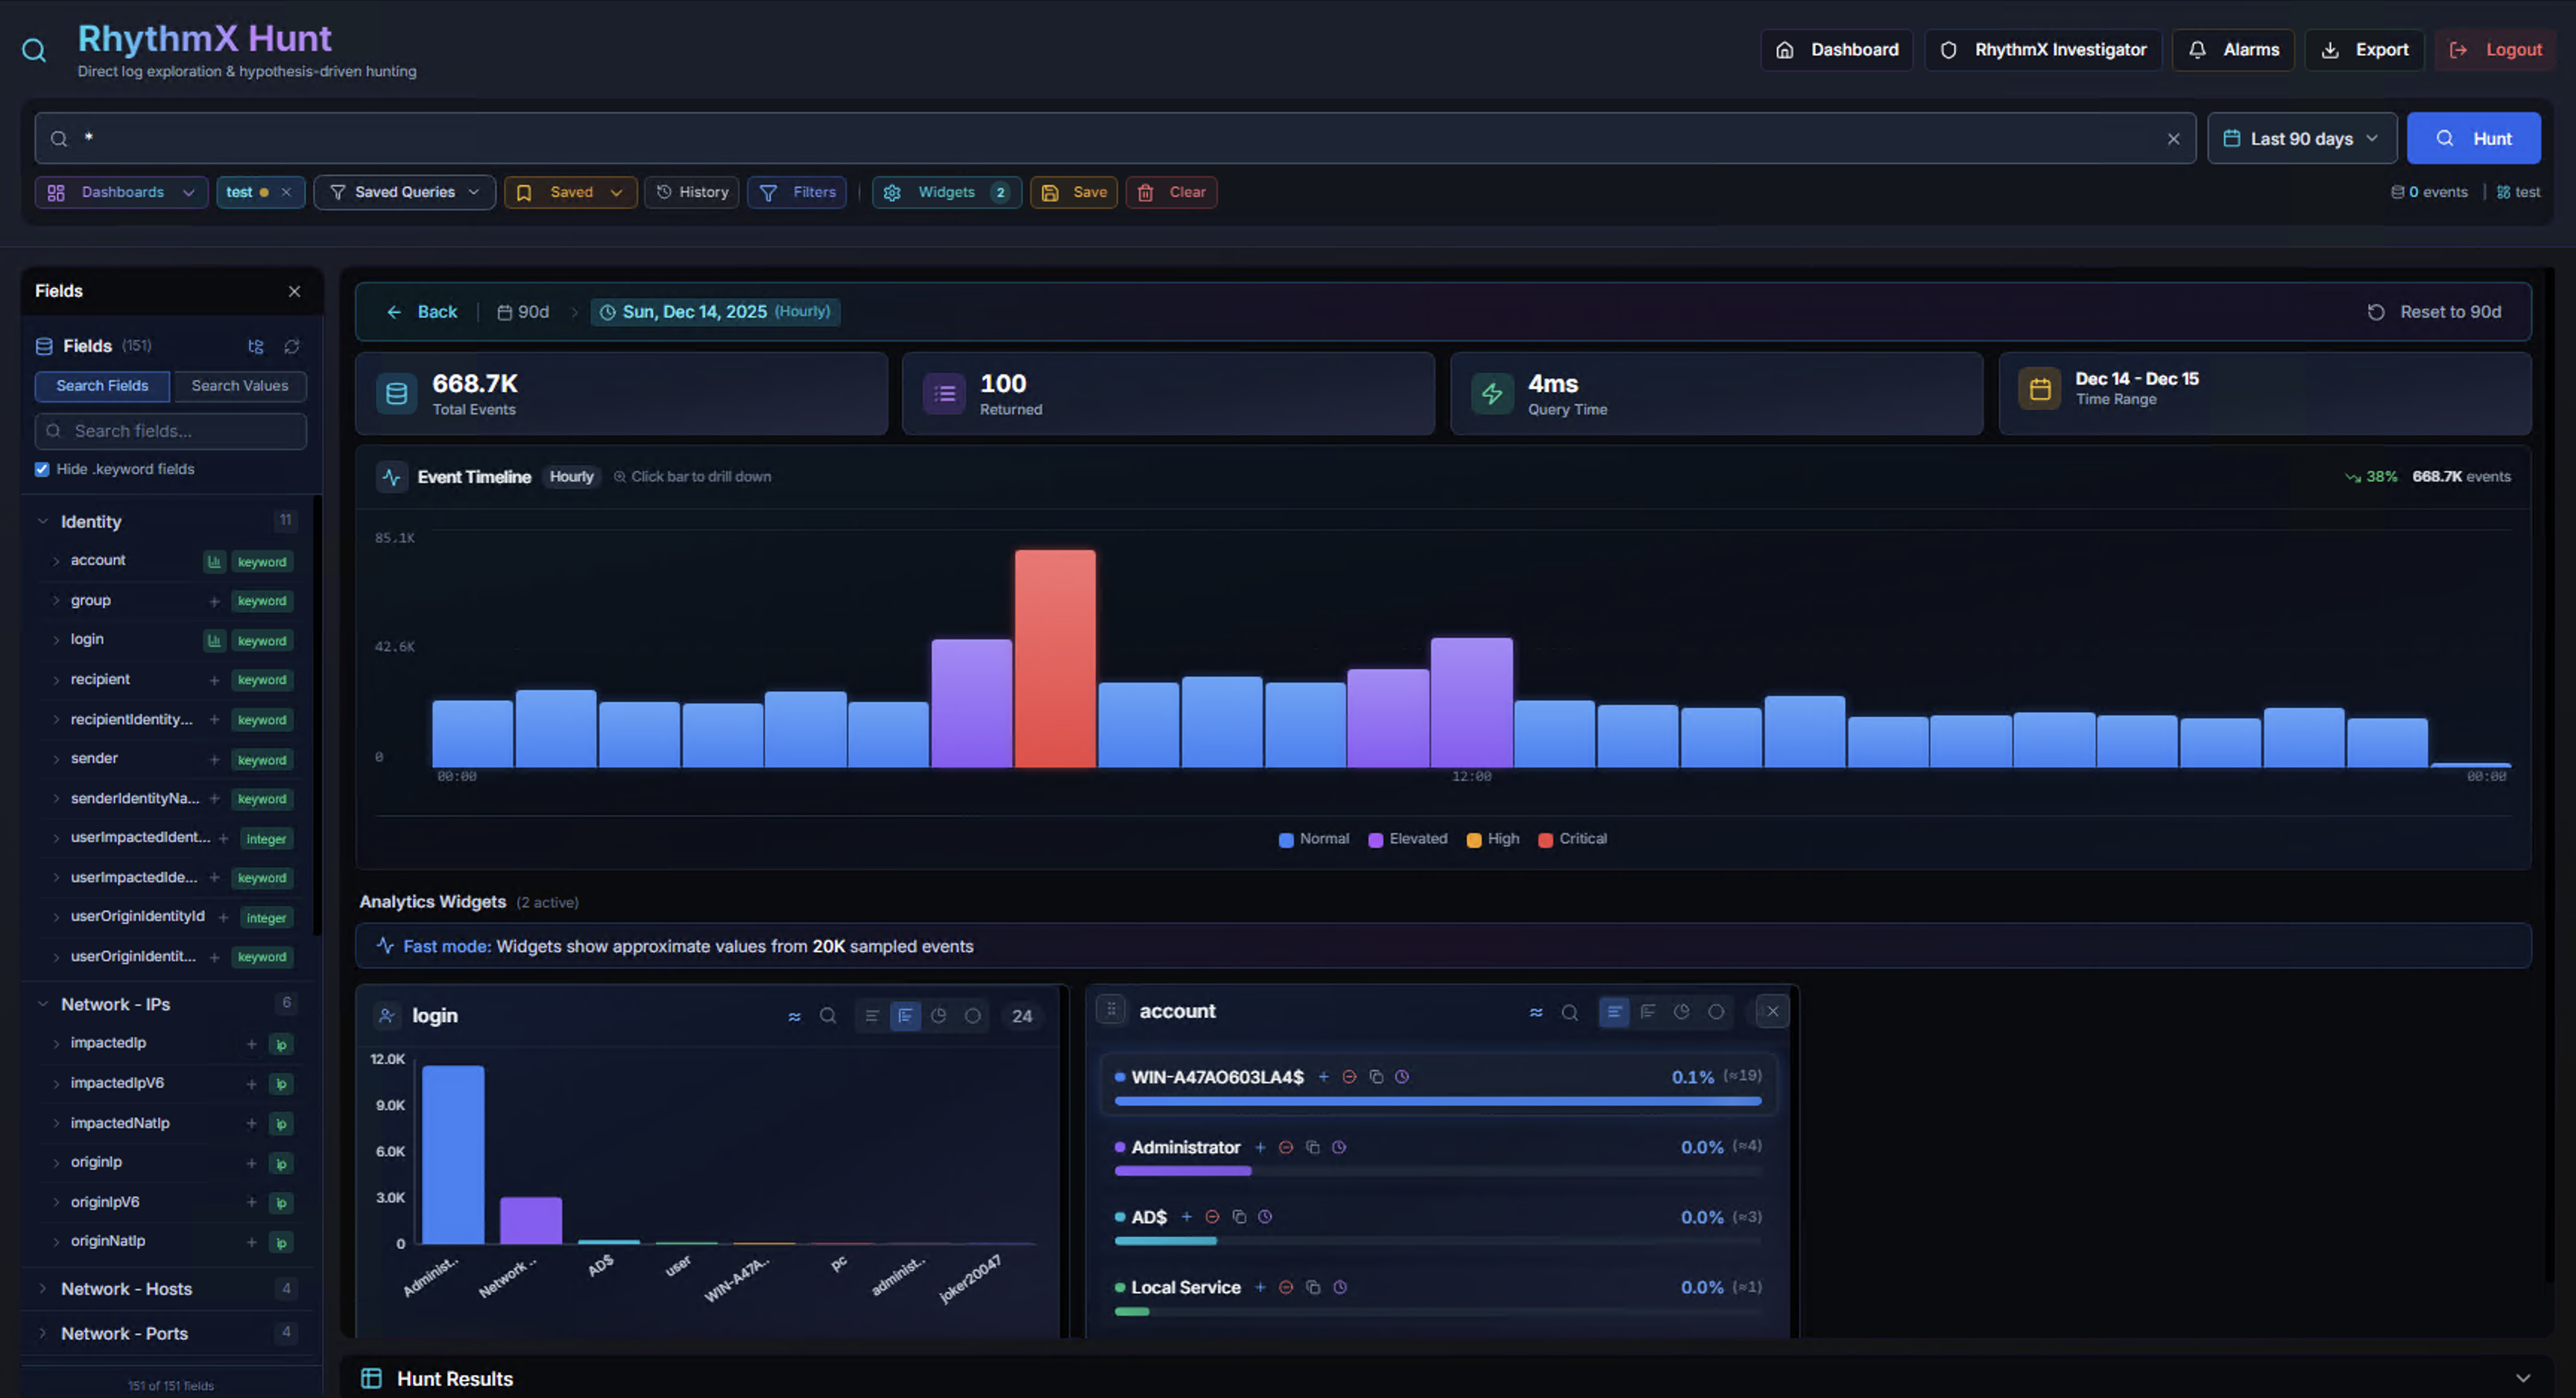
Event Timeline
Daily View
The Event Timeline displays a bar chart of event volume over time. Each bar is color-coded by severity:
| Color | Severity |
|---|---|
| Blue | Normal |
| Purple | Elevated |
| Orange/Yellow | High |
| Red/Pink | Critical |
Timeline Hover
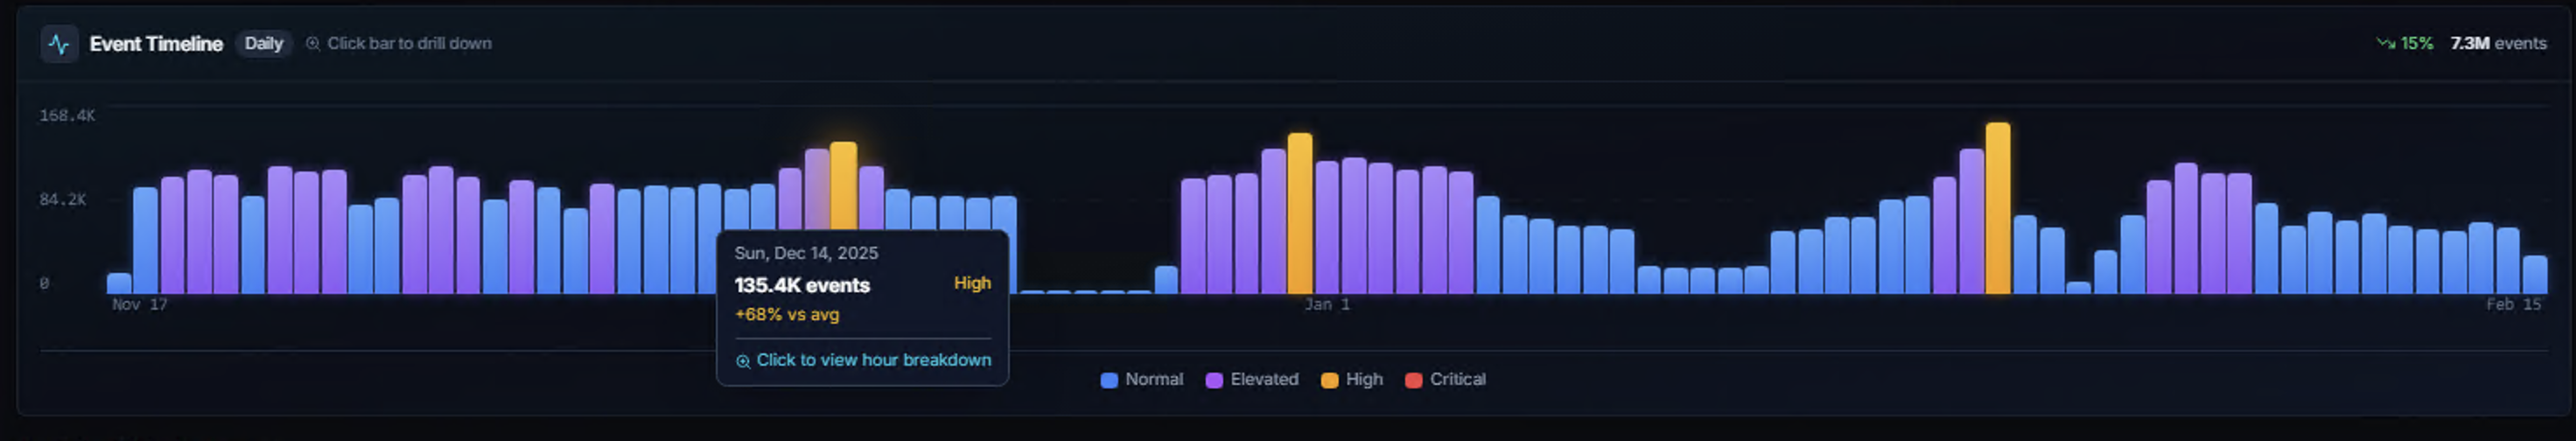
Hover over any bar to see:
- Date — The time period represented
- Event count — Total events in that period (e.g., 135.4K events)
- Severity level — Dominant severity classification
- Percentage vs average — How this period compares to the baseline (e.g., +69% vs avg)
- Click to view hour breakdown — Drill-down prompt
Hourly Drill-Down
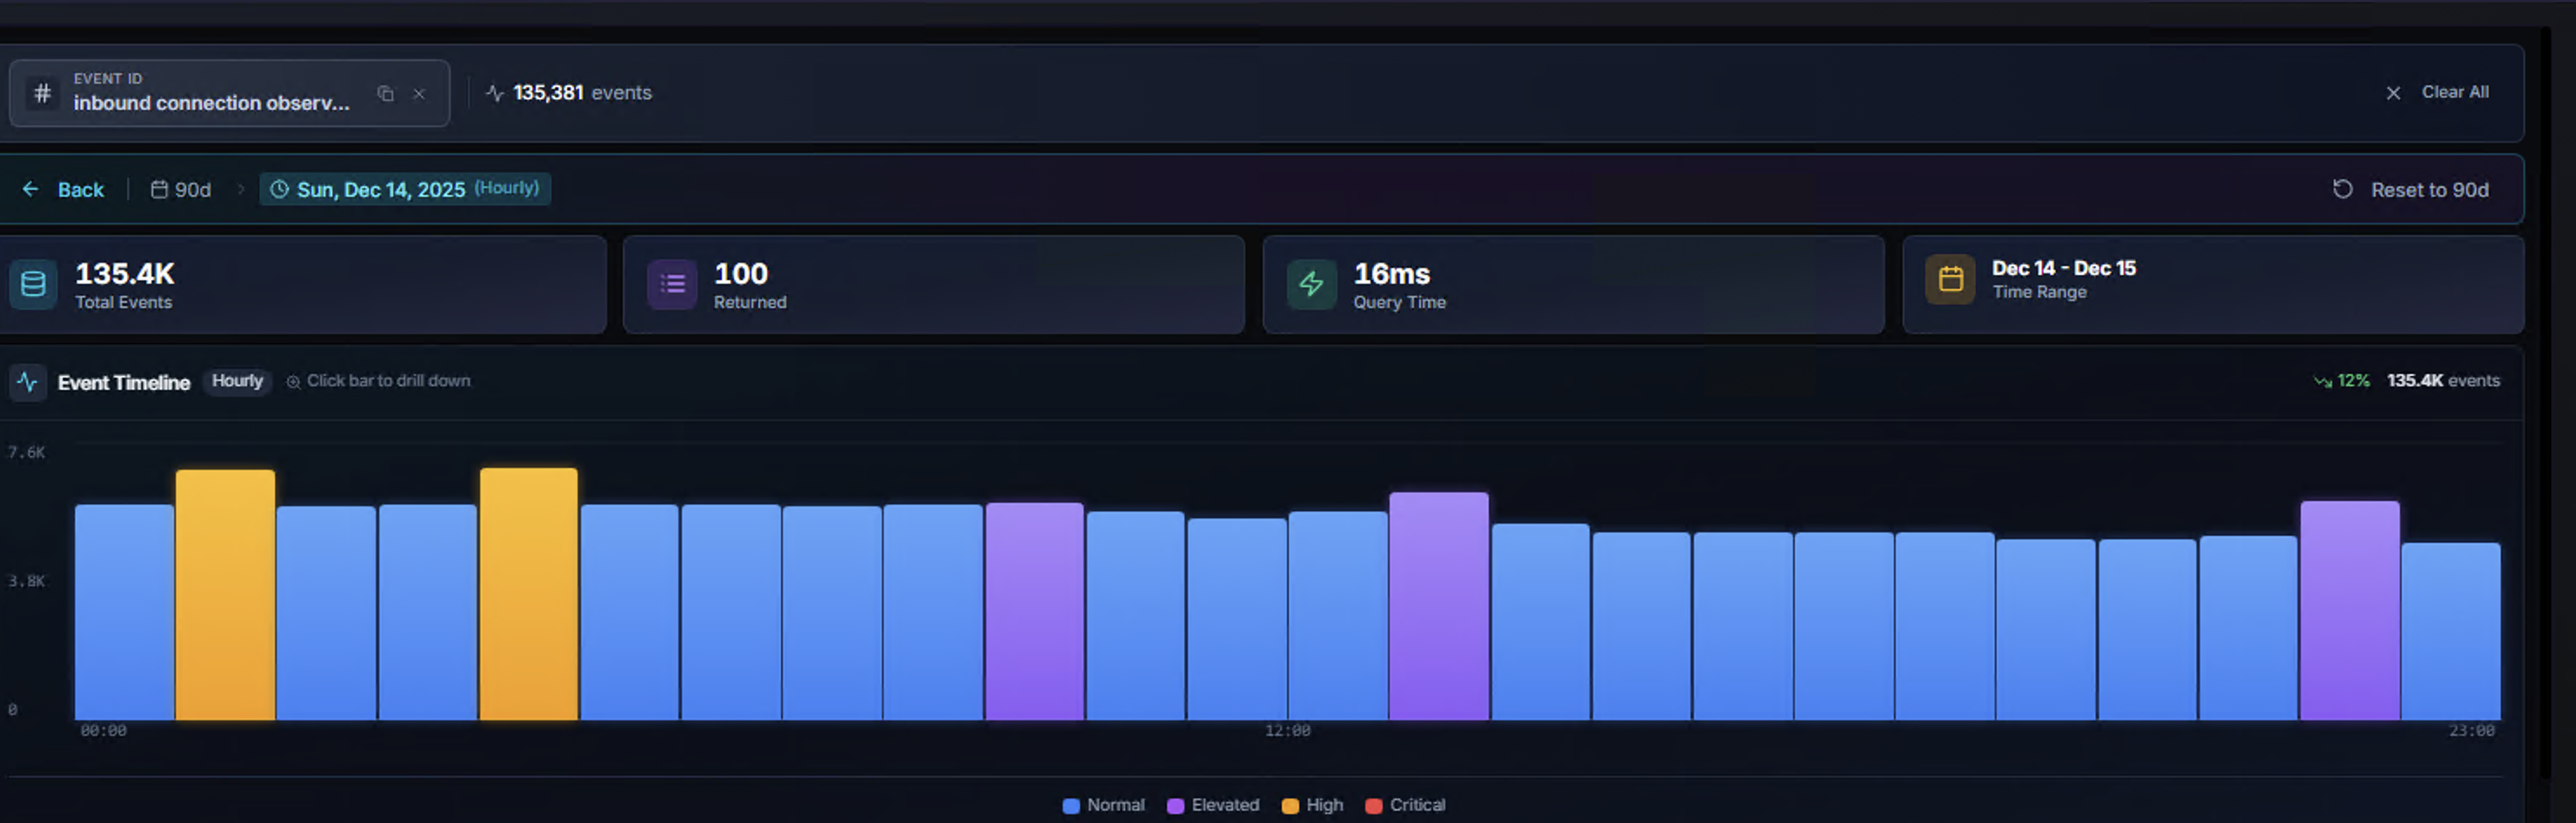
Click any daily bar to drill down into an hourly view for that specific day. The interface updates to show:
- Breadcrumb navigation — Back button to return to the full range, date label showing "Hourly" granularity
- Reset button — "Reset to 90d" (or original range) to return to the full view
- Hourly bar chart — Event distribution across the 24-hour period
- Updated KPIs — Filtered to the selected day
The timeline automatically adapts its granularity based on the selected time range:
| Time Range | Granularity | Max Buckets |
|---|---|---|
| Up to 4 hours | Hourly | 25 |
| 4–24 hours | Hourly | 25 |
| 1–7 days | Hourly | 50 |
| 8–30 days | Daily | 25 |
| Over 30 days | Daily | 20 |
Fields Panel
The left sidebar lists all searchable fields organized by category, with event counts next to each field name:
| Category | Example Fields |
|---|---|
| Identity | account, domain, group, login, sender, recipient, targetUser |
| Network - IPs | originIp, impactedIp |
| Network - Hosts | originHostName, impactedHostName |
| Network - Ports | originPort, impactedPort, protocolName, directionName |
| Network - Geo | originLocationName, impactedLocationName, originCountry, impactedCountry |
| Process | process, parentProcessName, command, application |
| Event | commonEventName, vendorMessageId, msgClassName, status, action, priority |
| Threat | threatName, cve, policy, mpeRuleName |
| Source | logSourceName, entityName, msgSourceTypeName |
Click any field in the sidebar to add it as an analytics widget. Use Search Fields to find specific field names. Toggle Active Only to show only fields with data in the current result set.
Analytics Widgets
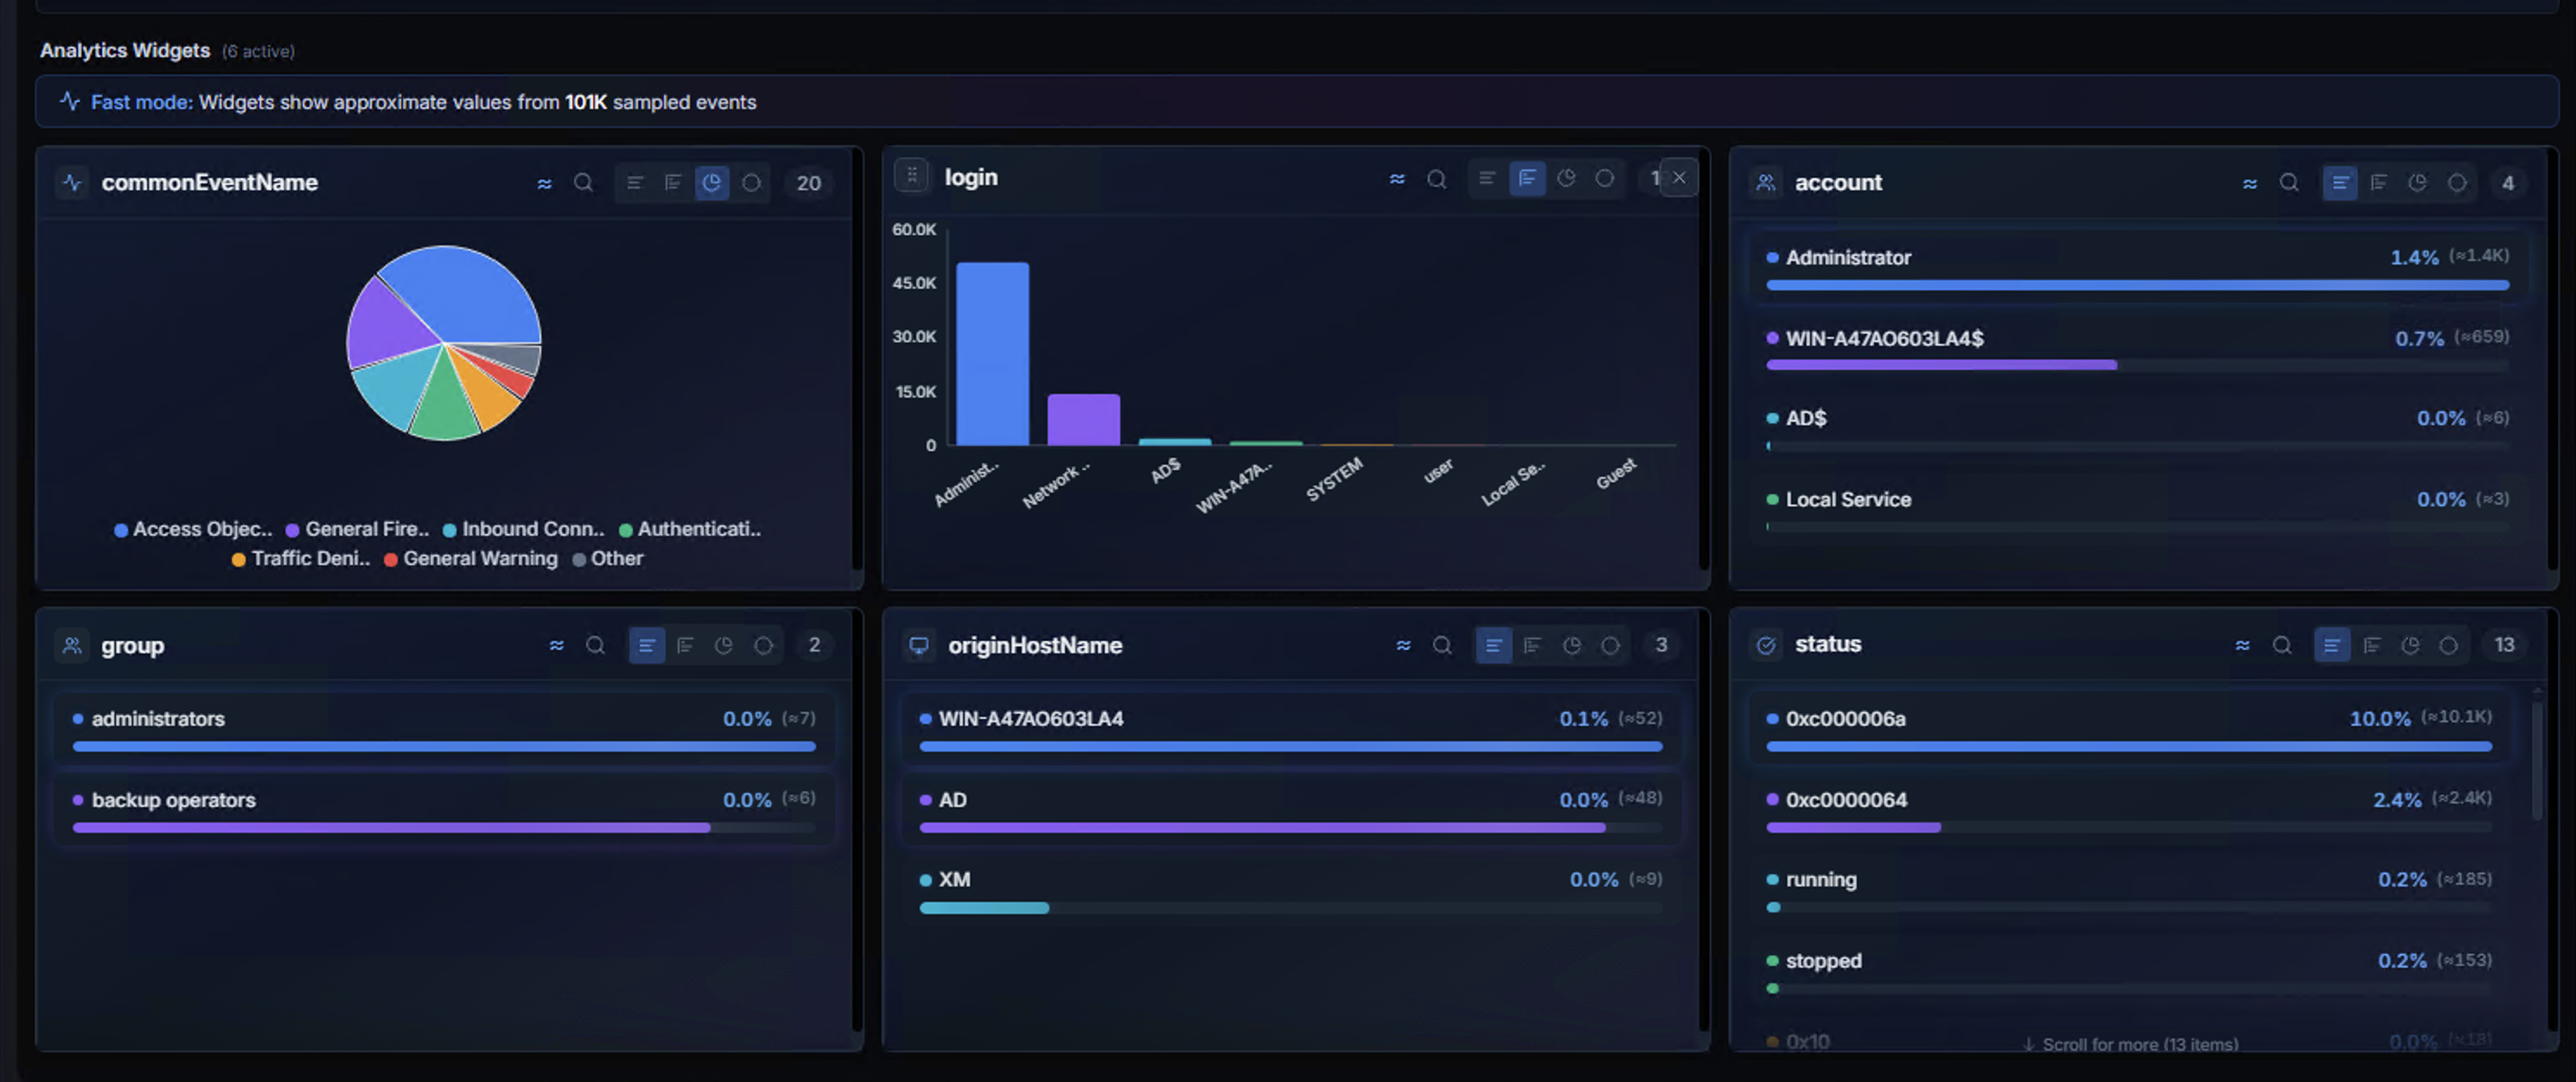
The Analytics Widgets section displays interactive breakdown charts for selected fields. Each widget shows the top values for that field with counts and percentages.
Widget Types
| Widget | Visualization | Example |
|---|---|---|
| commandEventName | Pie chart | Access Object Failure, General Firewall Log, Authentication Failure Activity |
| login | Bar chart | Administrator, Network Service, AIS |
| accountE | Ranked list | WIN-A4CN0I0SLA45, Administrator, Local Service |
| group | Ranked list | administrators, backup operators |
| originHostName | Ranked list | WIN-A4CN0I0SLA45, AD, XM |
| status | Ranked list | 0xc000006a, 0xc0000064, running, stopped |
Fast Mode
When querying large datasets, widgets display a notice: "Fast mode: Widgets show approximate values from N sampled events."
Interacting with Widgets
Click any value in a widget to filter the Hunt results to only events matching that value. This adds the filter as a chip in the search bar.
Hunt Results
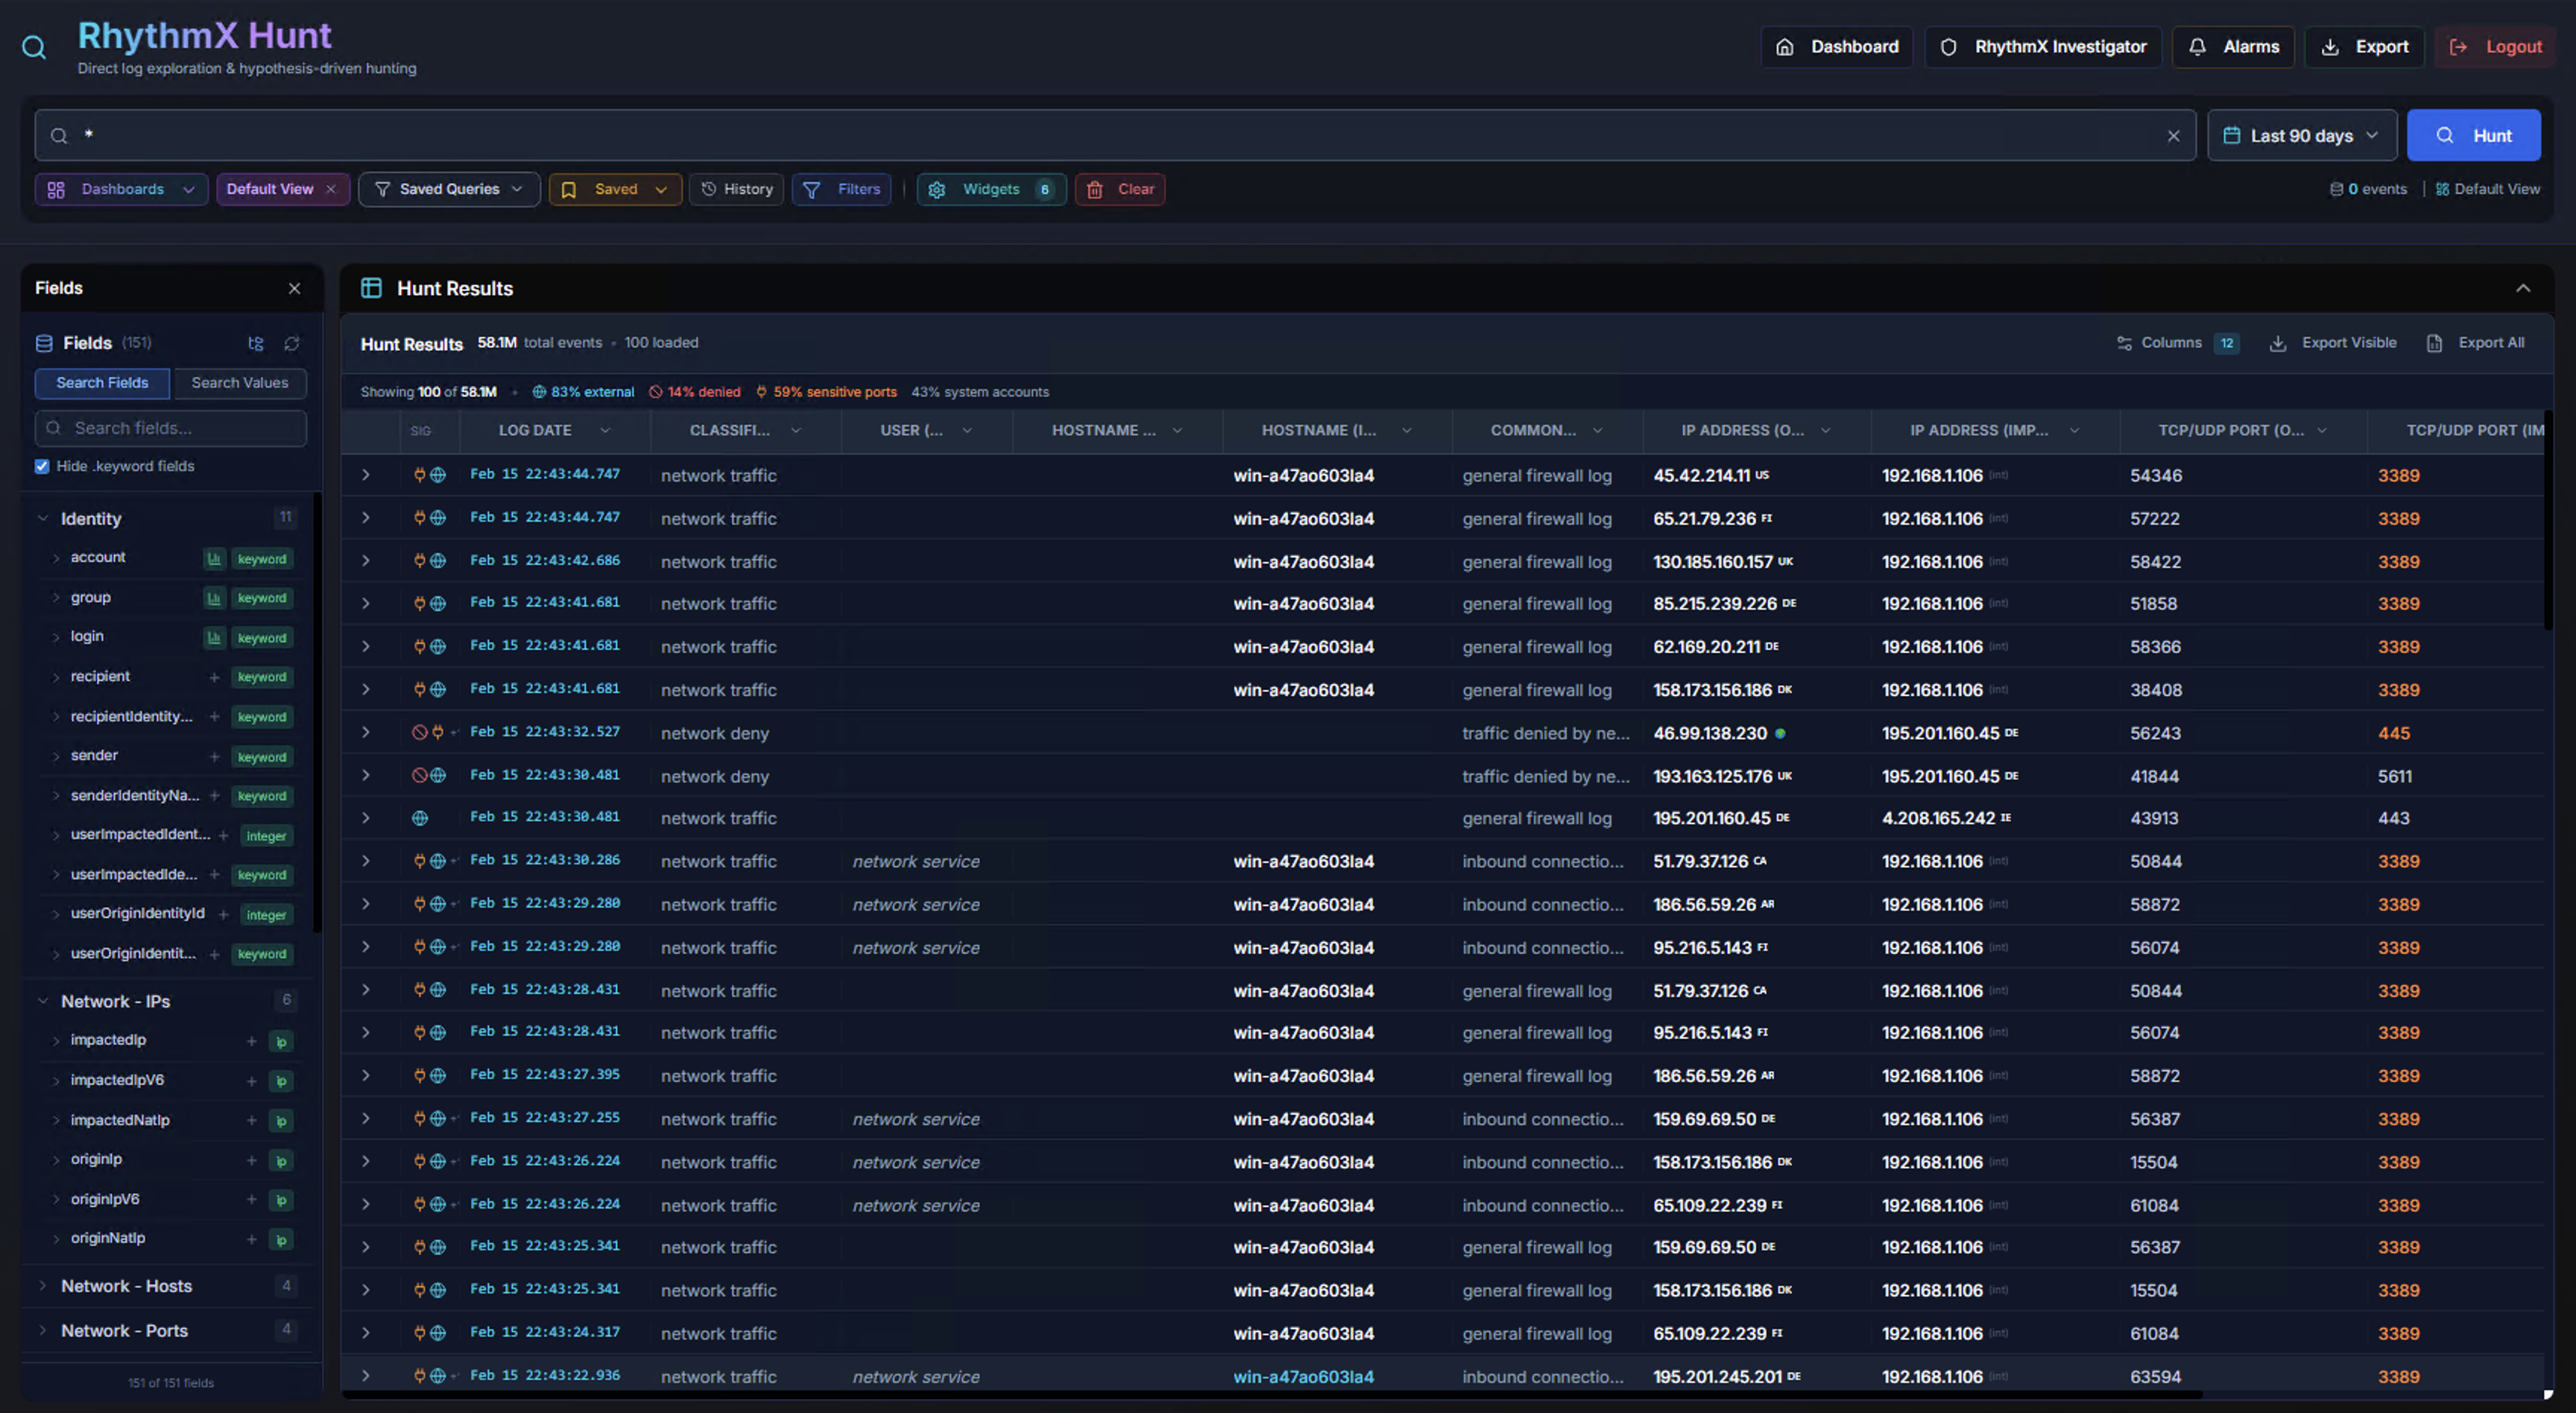
The Hunt Results table displays matching events in a paginated, sortable table. The header shows:
- Total event count (e.g., 58.1M)
- Pagination controls (50 or 100 results per page)
- Event classification indicators — SIS events, hit share, system posts, golden events percentage
Result Table Columns
| Column | Description |
|---|---|
| Timestamp | Event timestamp with severity color indicator |
| commandEventName | The event classification (e.g., network_traffic, endpoint_query) |
| computerName | Source system name |
| login | User account associated with the event |
| originHostName | Origin system |
| Network fields | Protocol, source/destination IPs and ports |
| status | Event status or result code |
Field Value Drill-Down
Click any column header or cell value to see a dropdown listing all unique values for that field with their counts. Select a value to filter the results.
Event Detail Panel
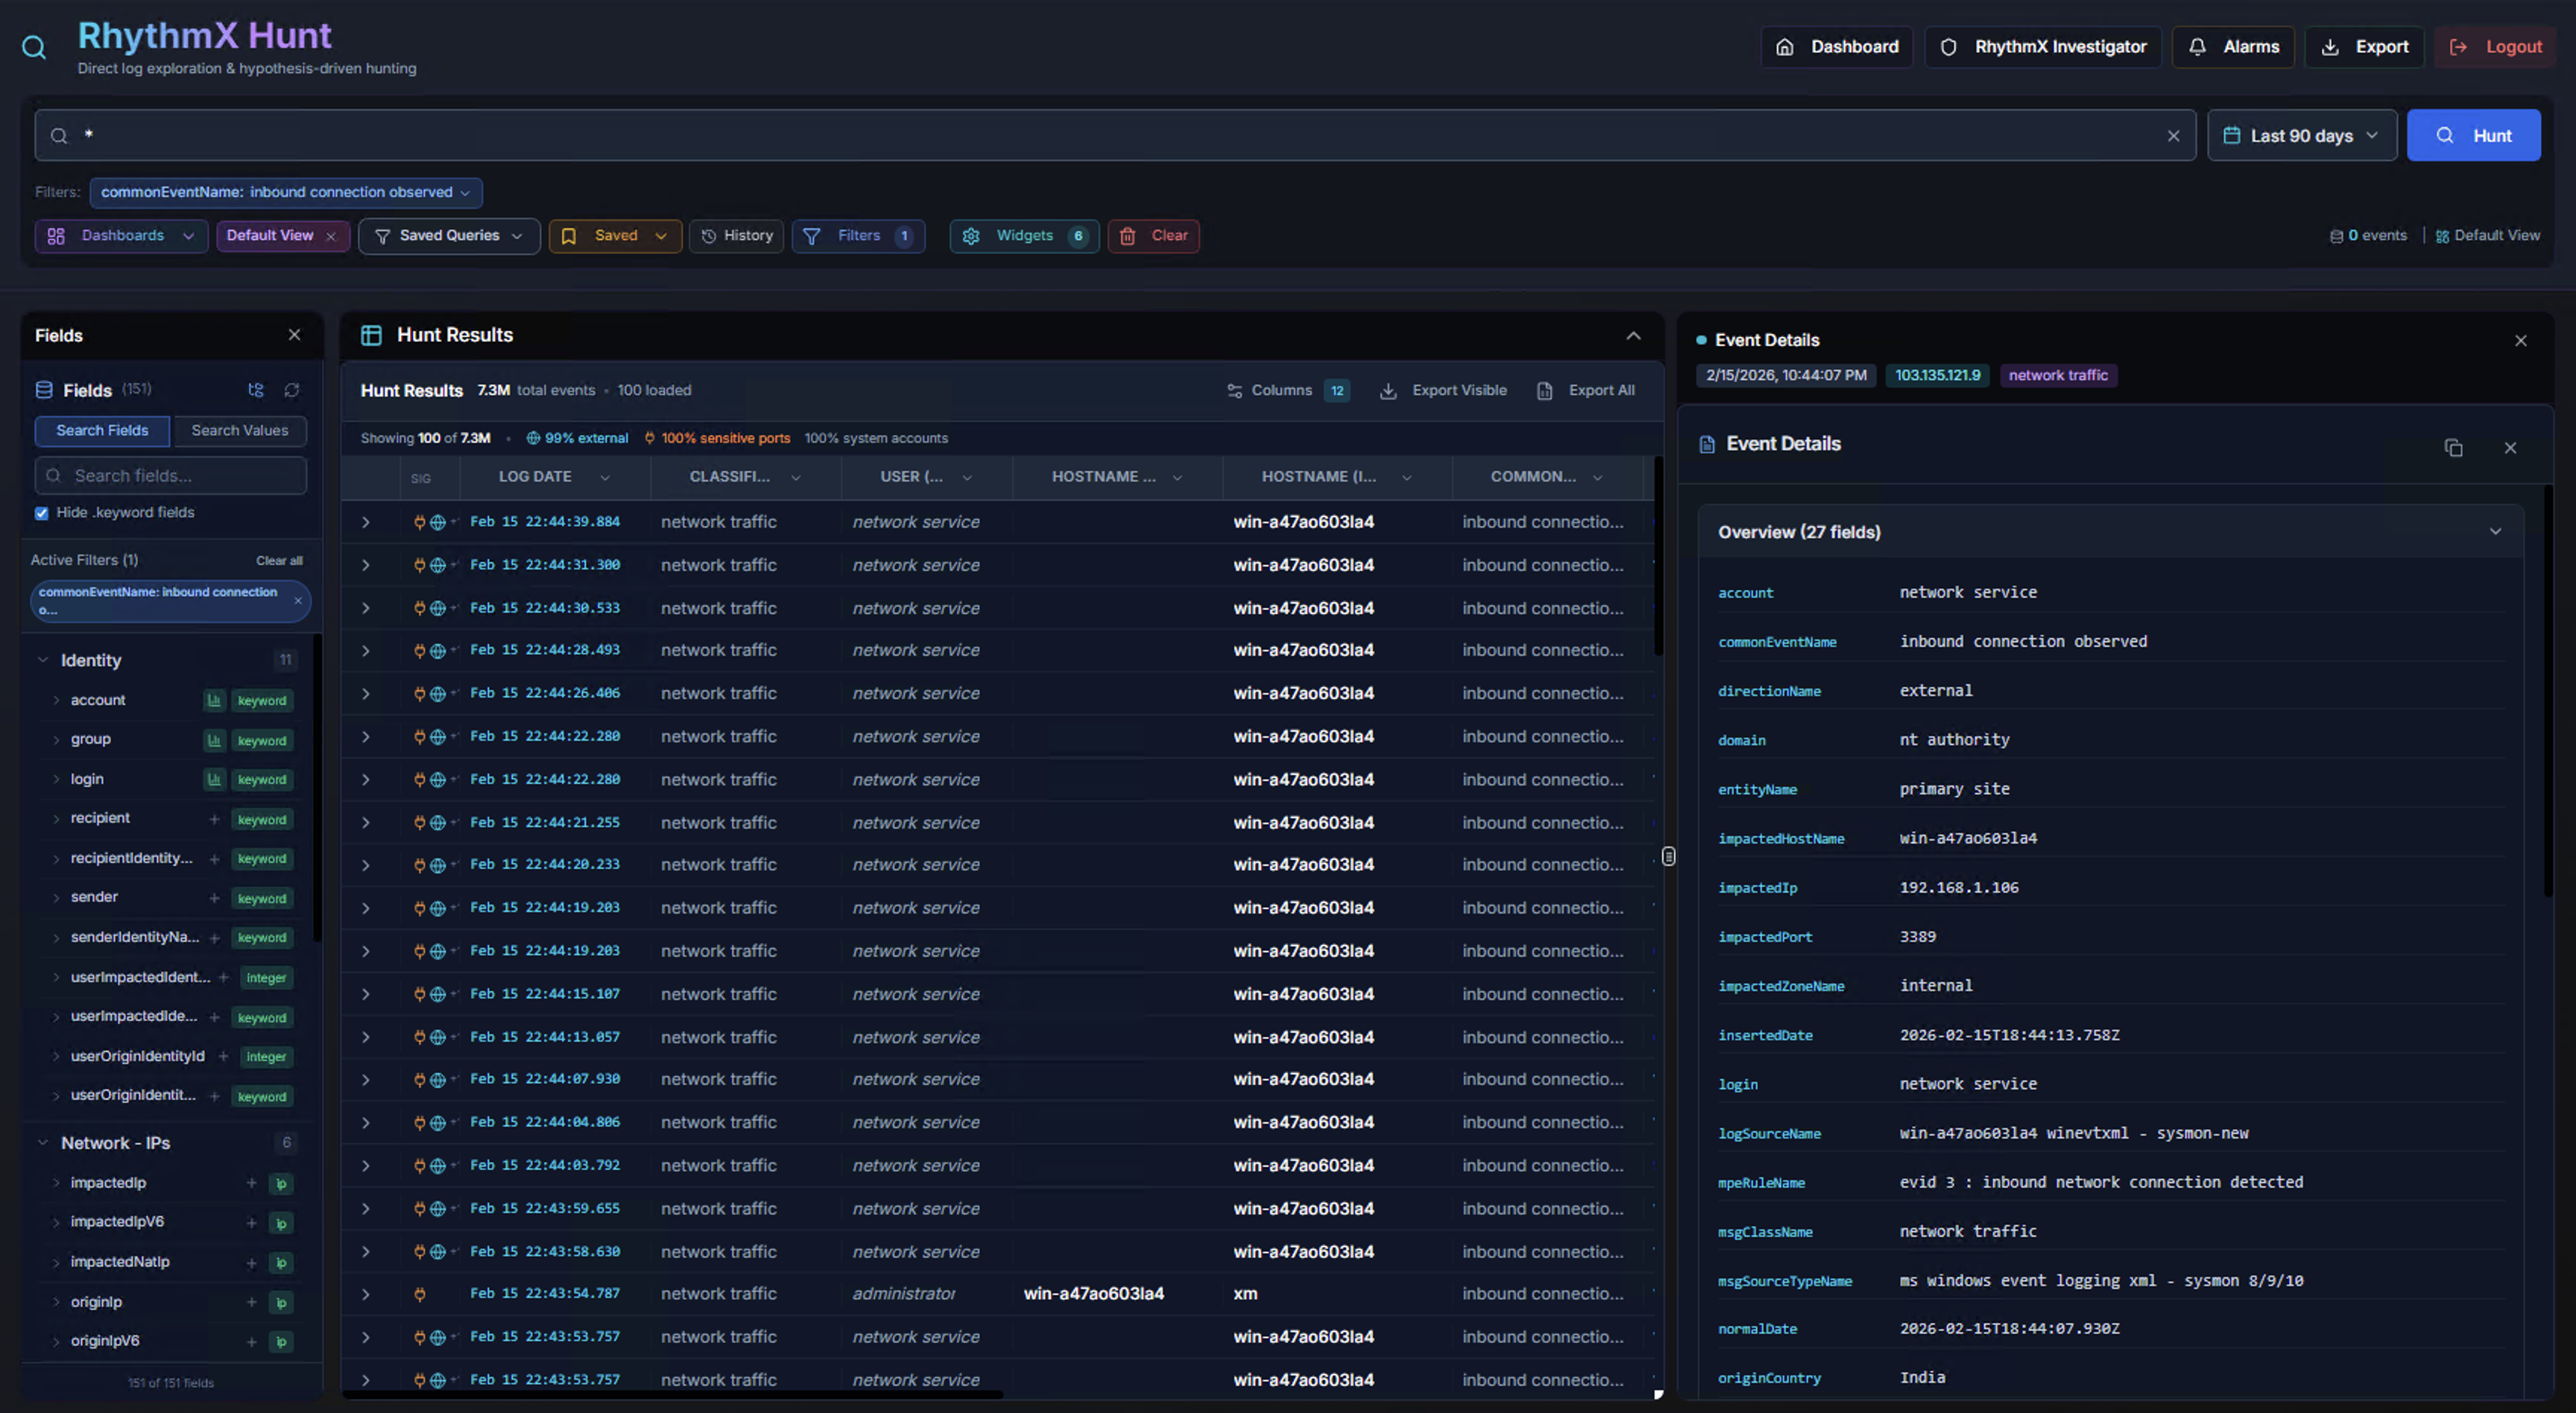
Click any row in the Hunt Results to open the Event Details panel on the right side. The panel shows:
Overview Tab:
All fields for the selected event displayed as key-value pairs, showing the field name, value, and count. Fields include: account, commandEventName, domain, entity, group, impactedZone, sourceIPs, MAC addresses, correlationId, vendor information, and more.
Full Event JSON:
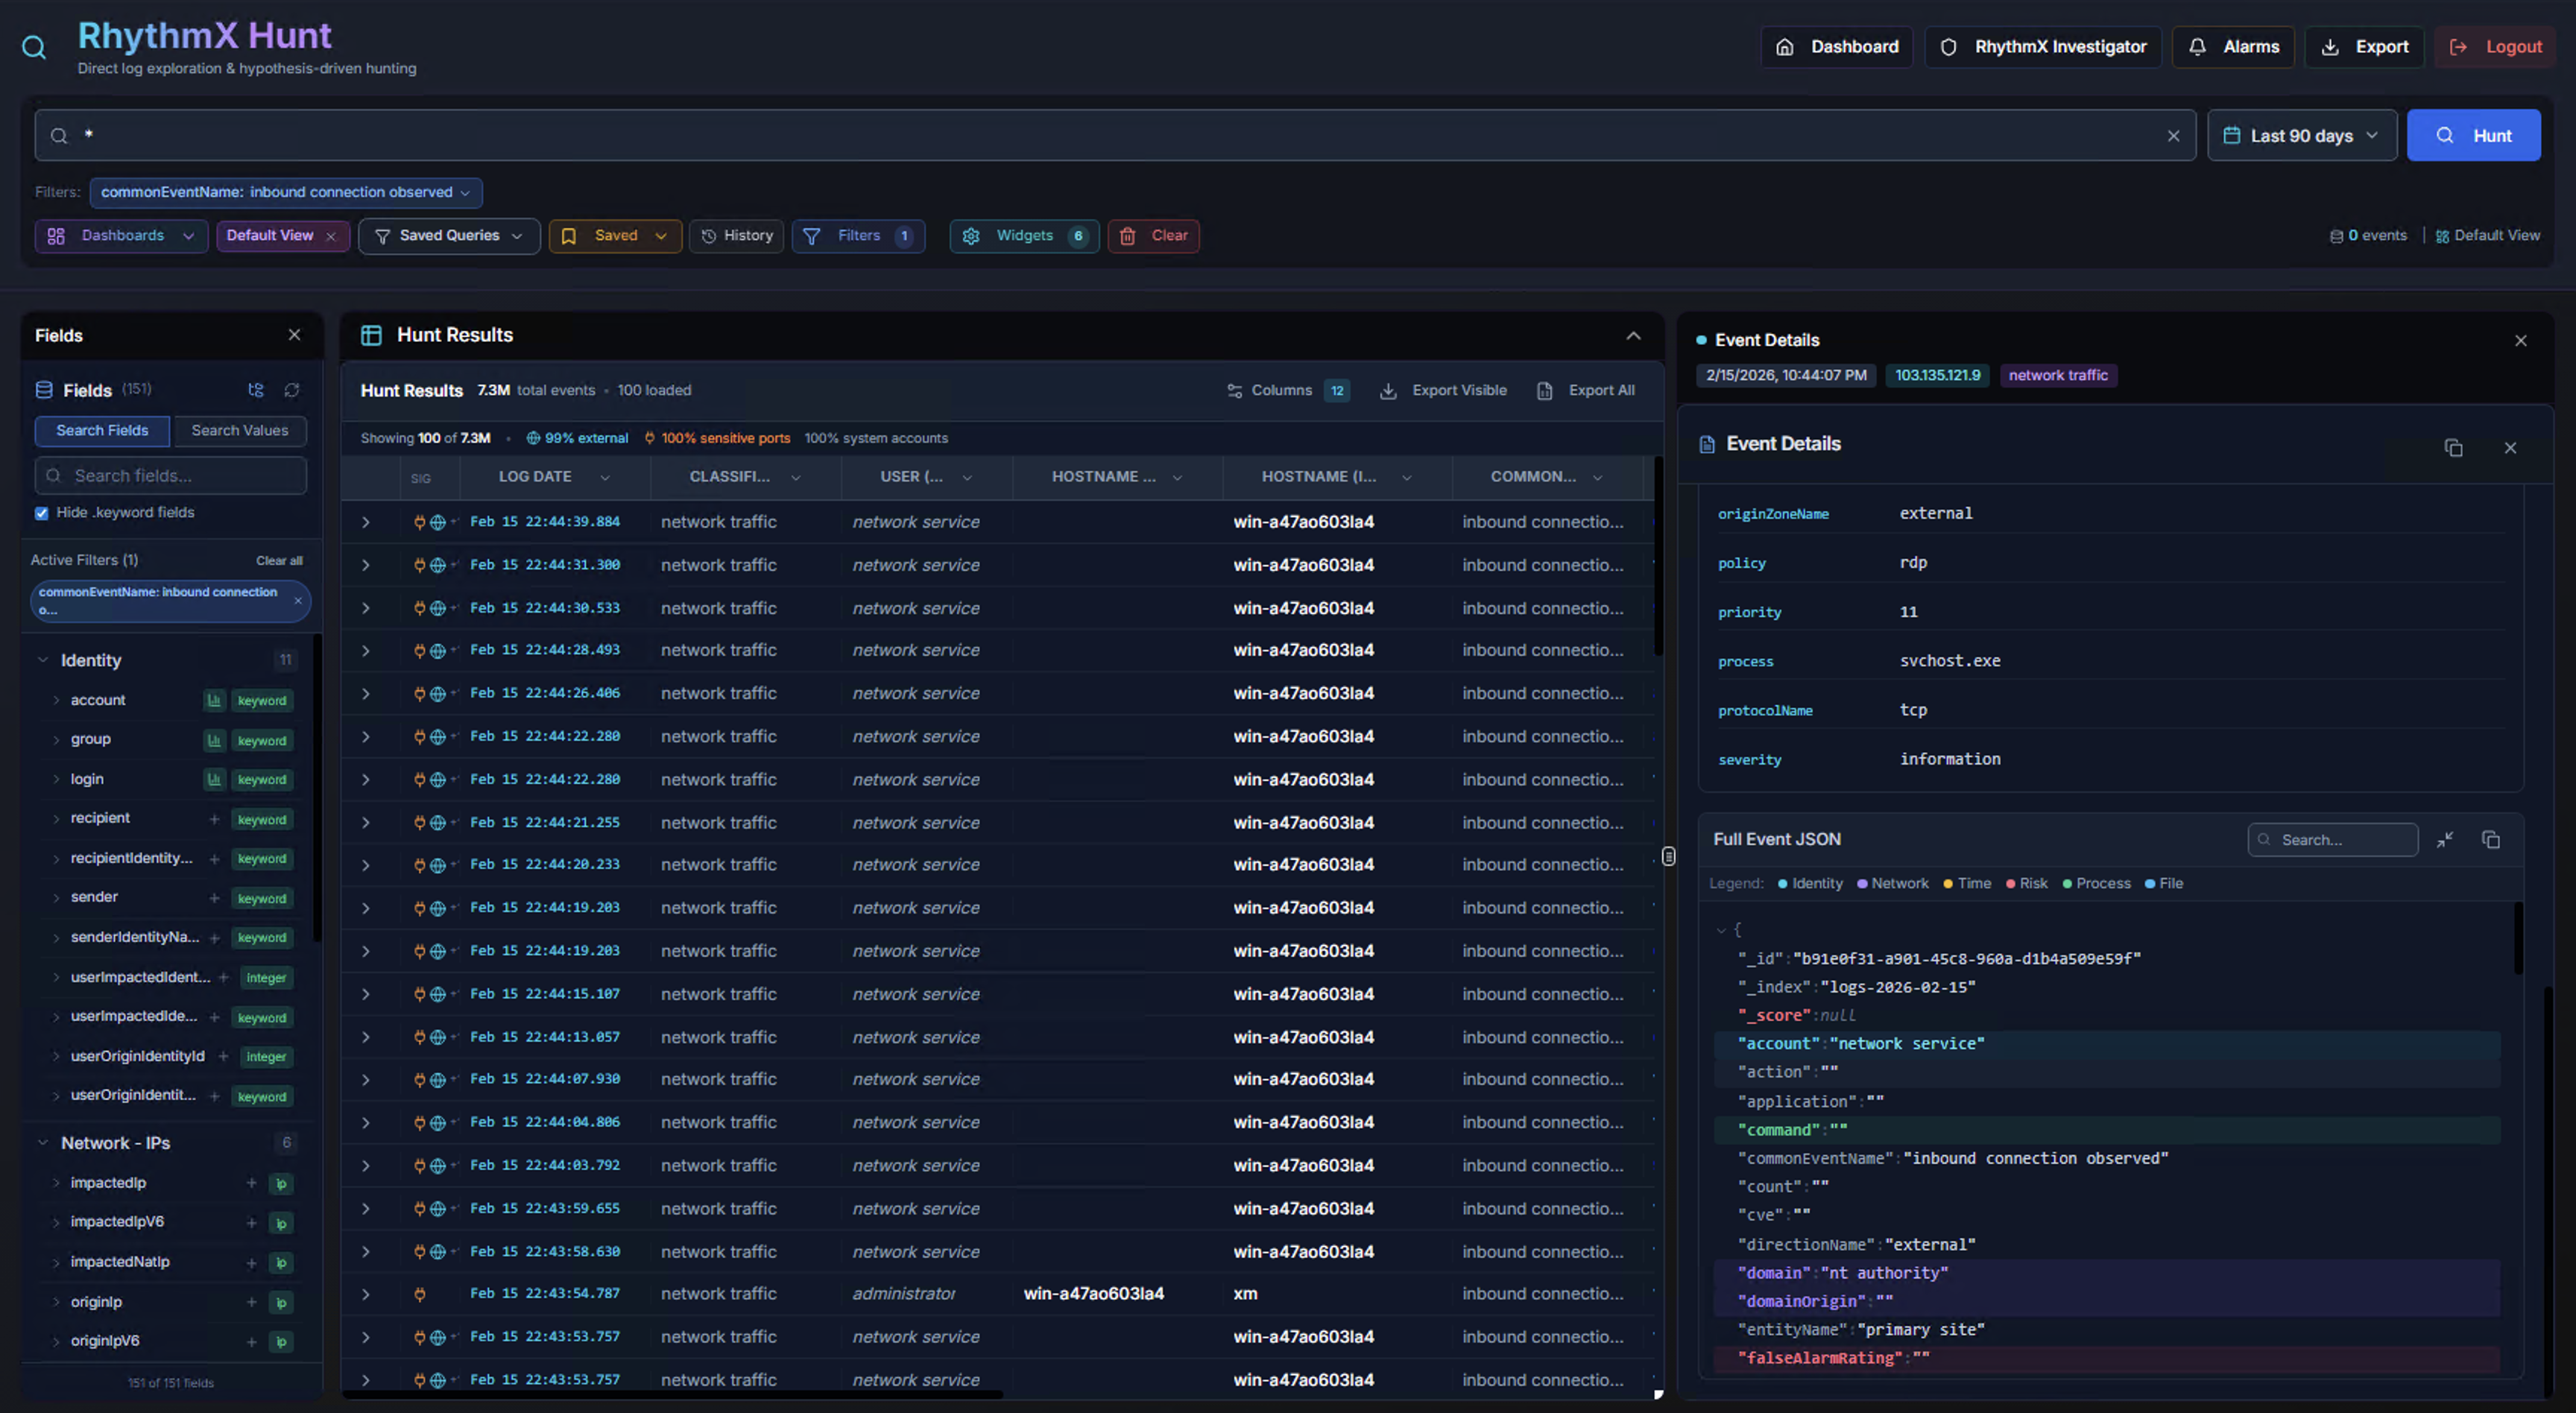
Scroll down in the Event Details panel to see the Full Event JSON — the complete raw event data in JSON format. Use the search, copy, and expand buttons to work with the raw data.
Saved Queries & Dashboards
Saved Queries List
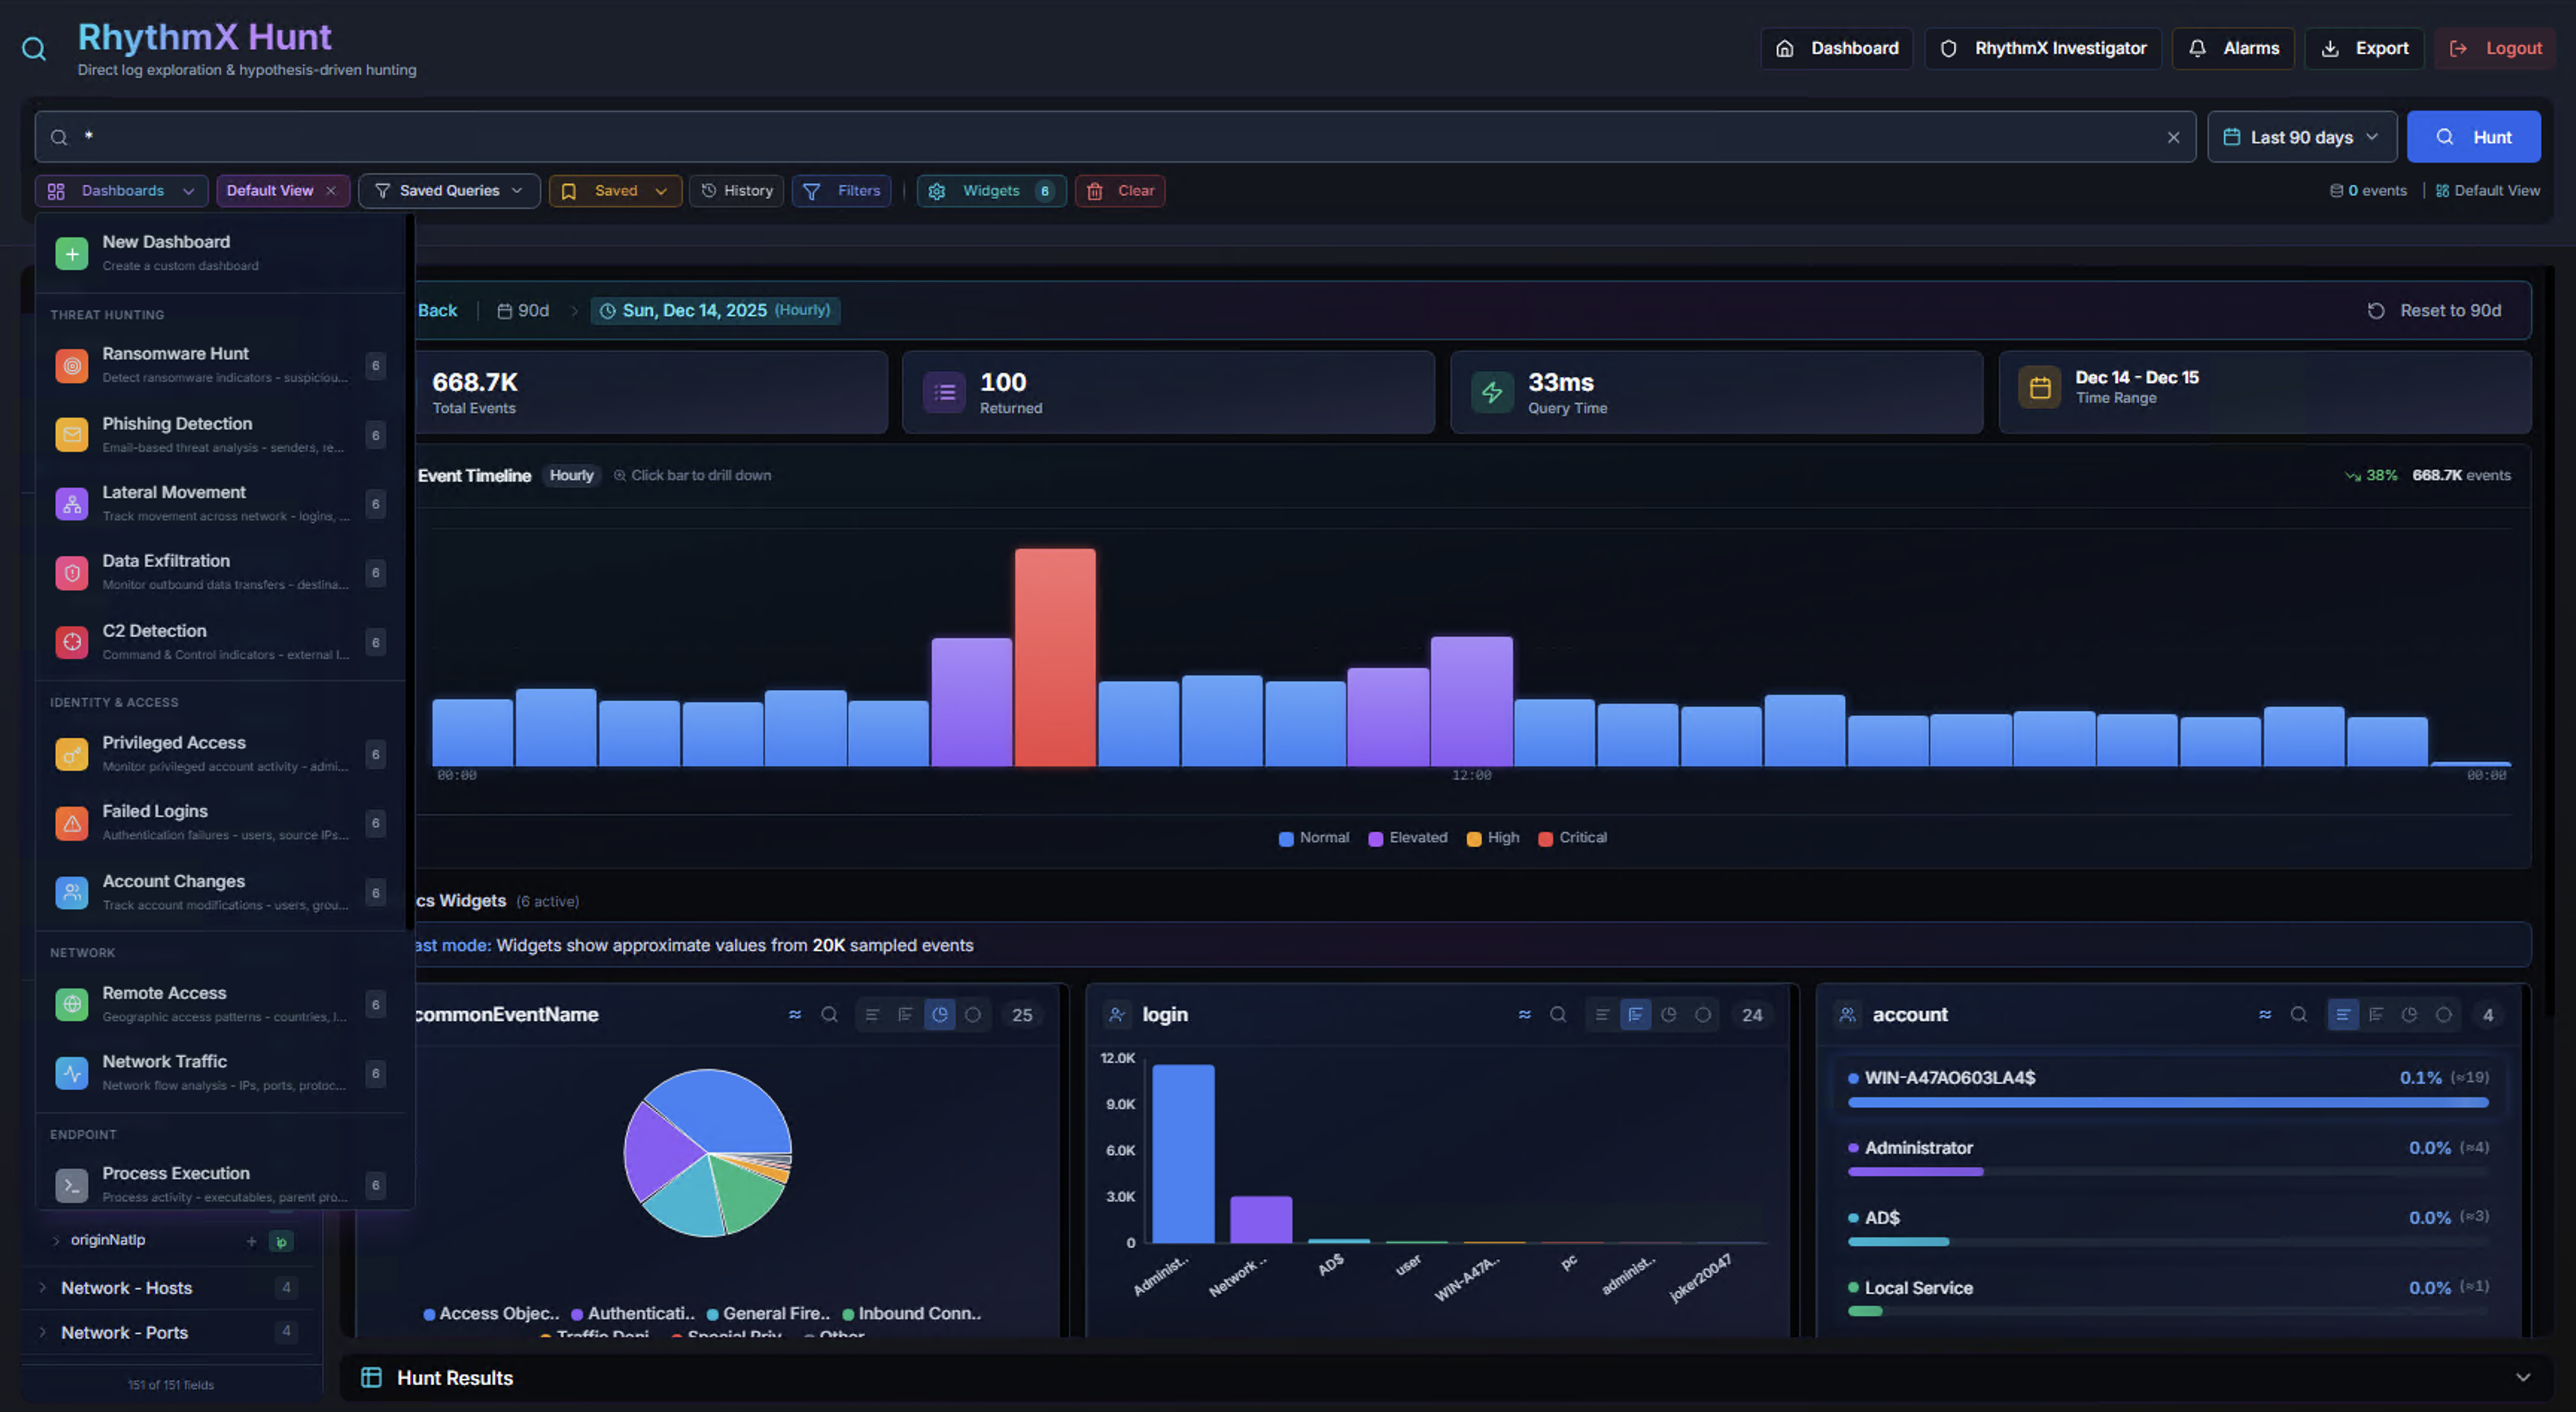
Click Saved Queries in the toolbar to open the saved queries panel. Pre-built hunt queries include:
- Reconnaissance Hunt
- Phishing Detection
- Lateral Movement
- Data Exfiltration
- C2 Detection
- Privileged Access
- Failed Logins
- Account Changes
- Remote Access
- Network Traffic
- Process Execution
Click any saved query to load it into the search bar and execute it.
Creating a Saved Query
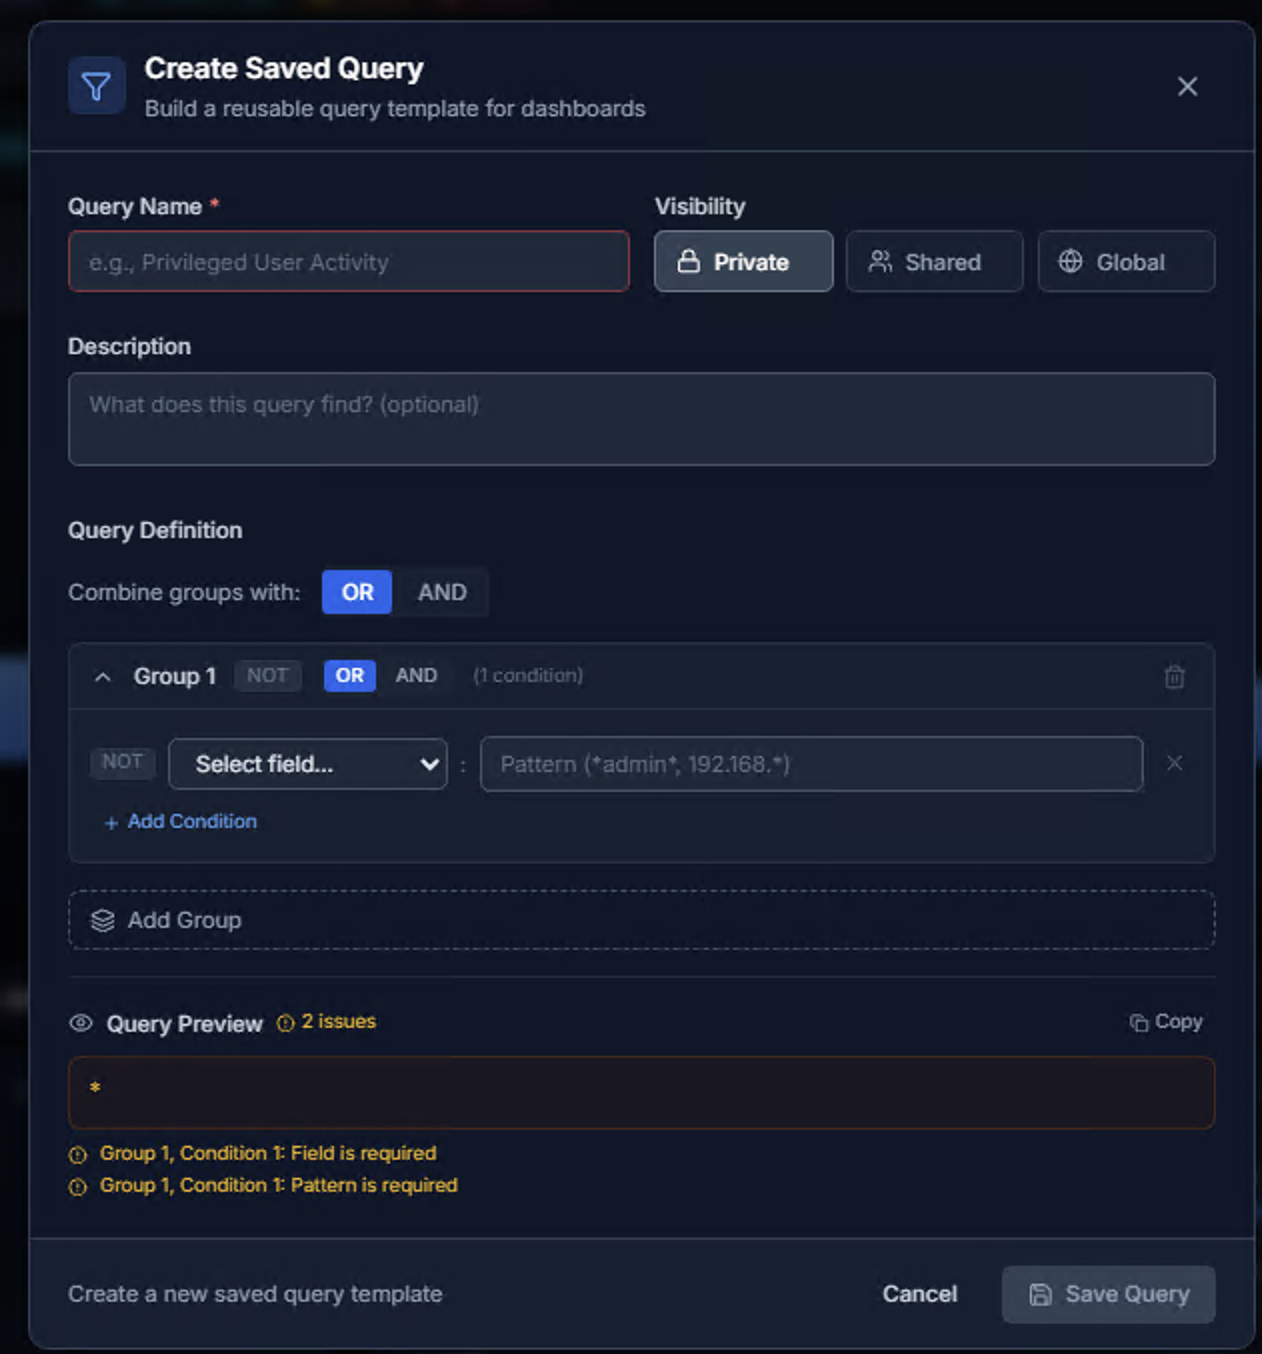
Click Save Query to create a reusable query template:
| Field | Description |
|---|---|
| Query Name | Descriptive name (e.g., "Privileged User Activity") |
| Visibility | Private (only you), Shared (specific users), or Global (all users) |
| Description | Optional text explaining what the query finds |
Query Definition:
Build structured queries using the visual query builder:
- Combine groups with — OR or AND logic between groups
- Groups — Each group contains one or more conditions combined with NOT/OR/AND
- Conditions — Select a field, enter a pattern (supports wildcards like
*admin*,192.168.*) - Add Condition — Add more conditions to a group
- Add Group — Create additional condition groups
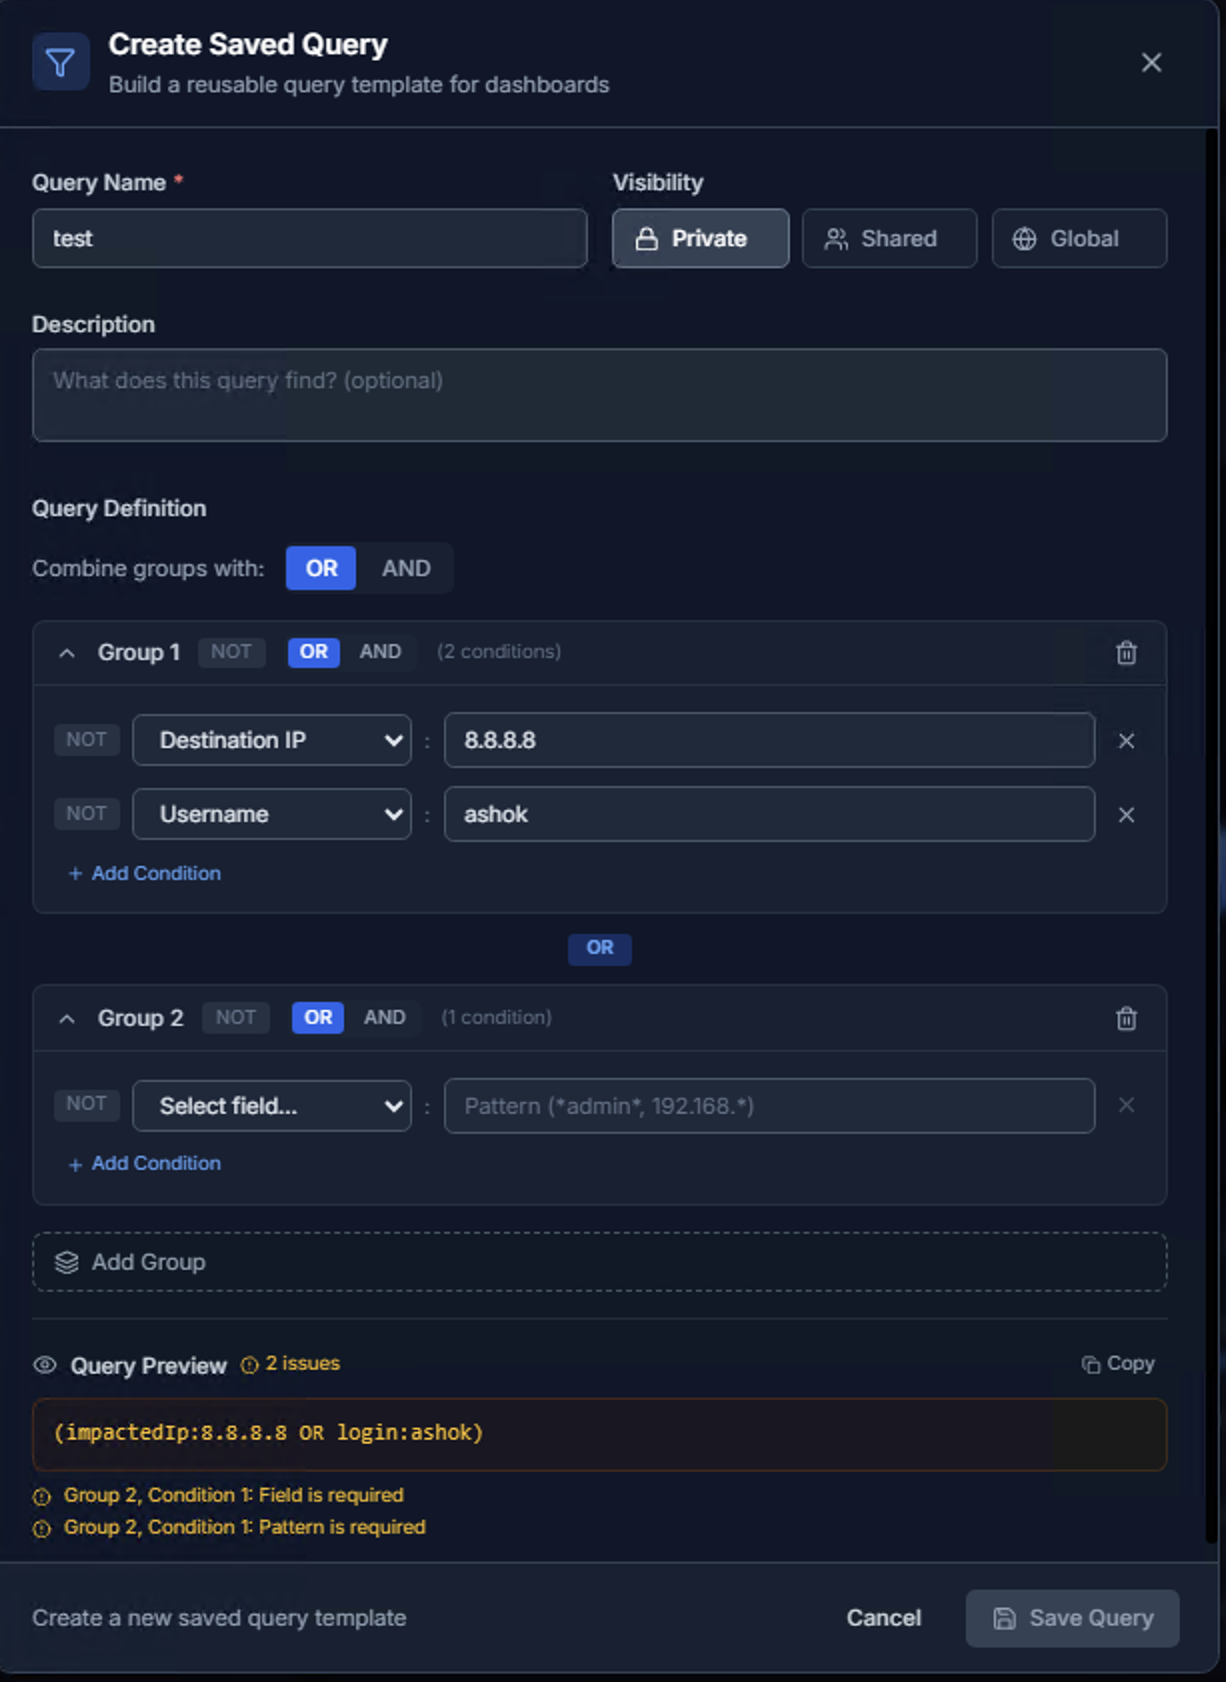
The Query Preview shows the generated query in real-time. For example, two conditions (Destination IP = 8.8.8.8 OR Username = ashok) generates:
(impactedIp:8.8.8.8 OR login:ashok)
Validation warnings appear if required fields are missing. Click Save Query to save.
Creating a Dashboard
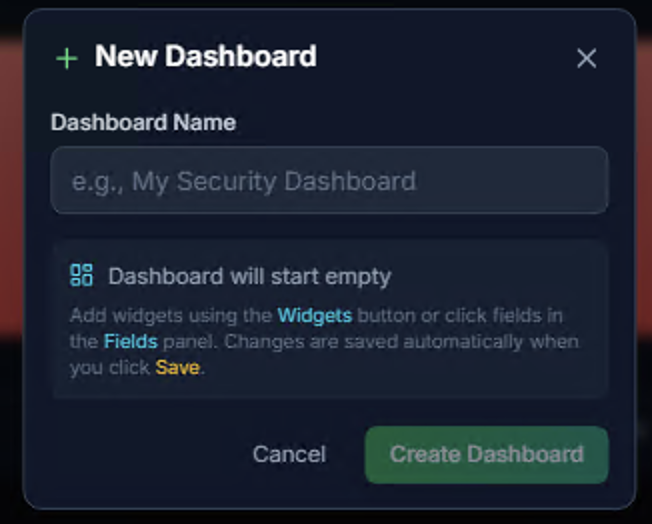
Click New Dashboard to create a custom widget layout:
- Enter a Dashboard Name (e.g., "My Security Dashboard")
- Click Create Dashboard
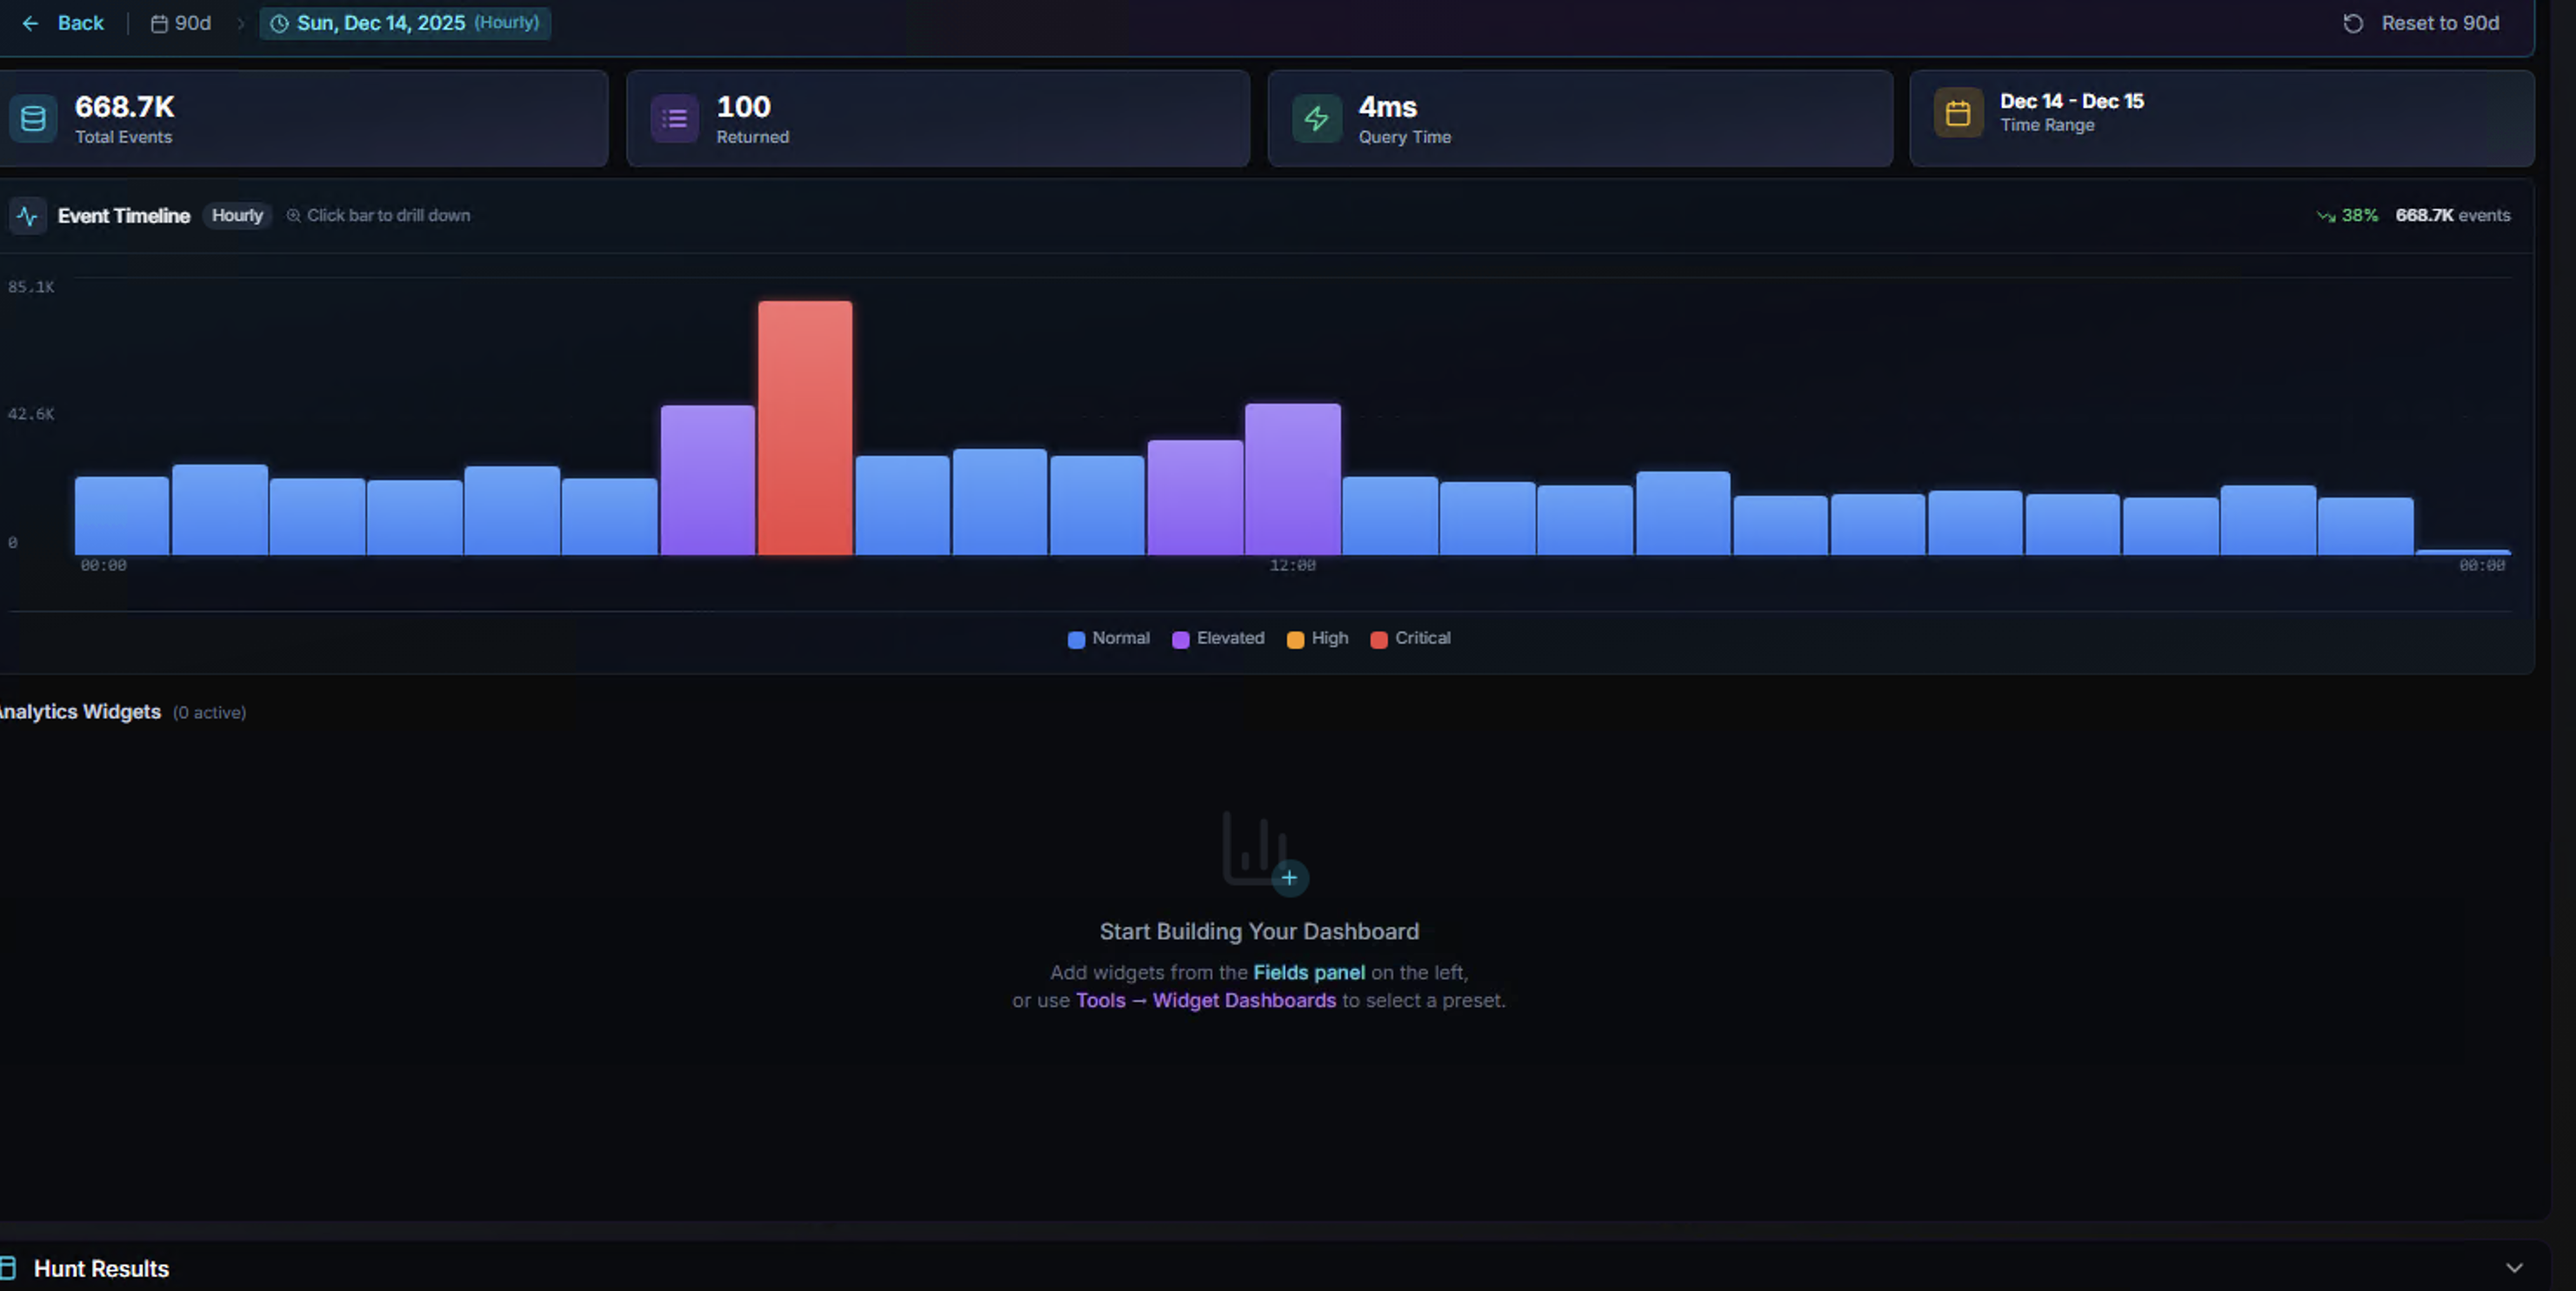
The new dashboard starts empty with the message: "Start Building Your Dashboard — Add widgets from the Fields panel on the left, or use Tools → Widget Dashboards to select a preset."
Click fields in the left panel to add widgets. Each widget appears as an interactive chart showing the top values for that field. Dashboards are saved automatically.
Multi-Cluster Support
For multi-site deployments with multiple LogRhythm Data Indexer (DX) clusters, RhythmX Hunt can query across all clusters from a single interface. Configure remote clusters in System Settings > DX Clusters.
When multiple clusters are configured, use the cluster selector to choose:
- Local — Query only the primary DX cluster
- All — Cross-cluster search across all connected DX clusters
- Specific cluster — Target a named remote cluster
Hunt Workflow Summary
flowchart TD
    A[Security Control Center<br><b>Start Hunting</b>] --> B[Hunt Interface<br><b>Search Bar + Timeline</b>]
    B --> C{Search Method}
    C --> D[Free-Text Search<br><b>Type query directly</b>]
    C --> E[Field Search<br><b>field:value syntax</b>]
    C --> F[Saved Query<br><b>Load pre-built query</b>]
    D --> G[Results<br><b>Timeline + Widgets + Events</b>]
    E --> G
    F --> G
    G --> H[Timeline Drill-Down<br><b>Daily → Hourly</b>]
    G --> I[Widget Filtering<br><b>Click to filter by value</b>]
    G --> J[Event Details<br><b>Full event data + JSON</b>]
    G --> K[Save Query<br><b>Reusable query template</b>]
G --> L[Export<br><b>Download results</b>]| Step | What the Analyst Does | Key Decision |
|---|---|---|
| 1. Set Time Range | Choose the investigation window (preset or custom) | How far back to search? |
| 2. Search | Enter a query, use autocomplete, or load a saved query | What am I looking for? |
| 3. Review Timeline | Examine the event volume chart for spikes and patterns | When did activity peak? |
| 4. Drill Down | Click a timeline bar to zoom into hourly detail | What happened during that period? |
| 5. Analyze Widgets | Review field breakdowns for top values and anomalies | What stands out? |
| 6. Examine Events | Click individual events to see full detail and raw JSON | Is this malicious or benign? |
| 7. Refine & Save | Narrow the search, save useful queries for reuse | How do I track this going forward? |