Case Management
Case Management is where analysts track, investigate, and resolve correlated threat cases. Cases are automatically generated by the RhythmX Analytics correlation engine when alert patterns match a threat use case, and can also be created manually from the LogRhythm SIEM integration.
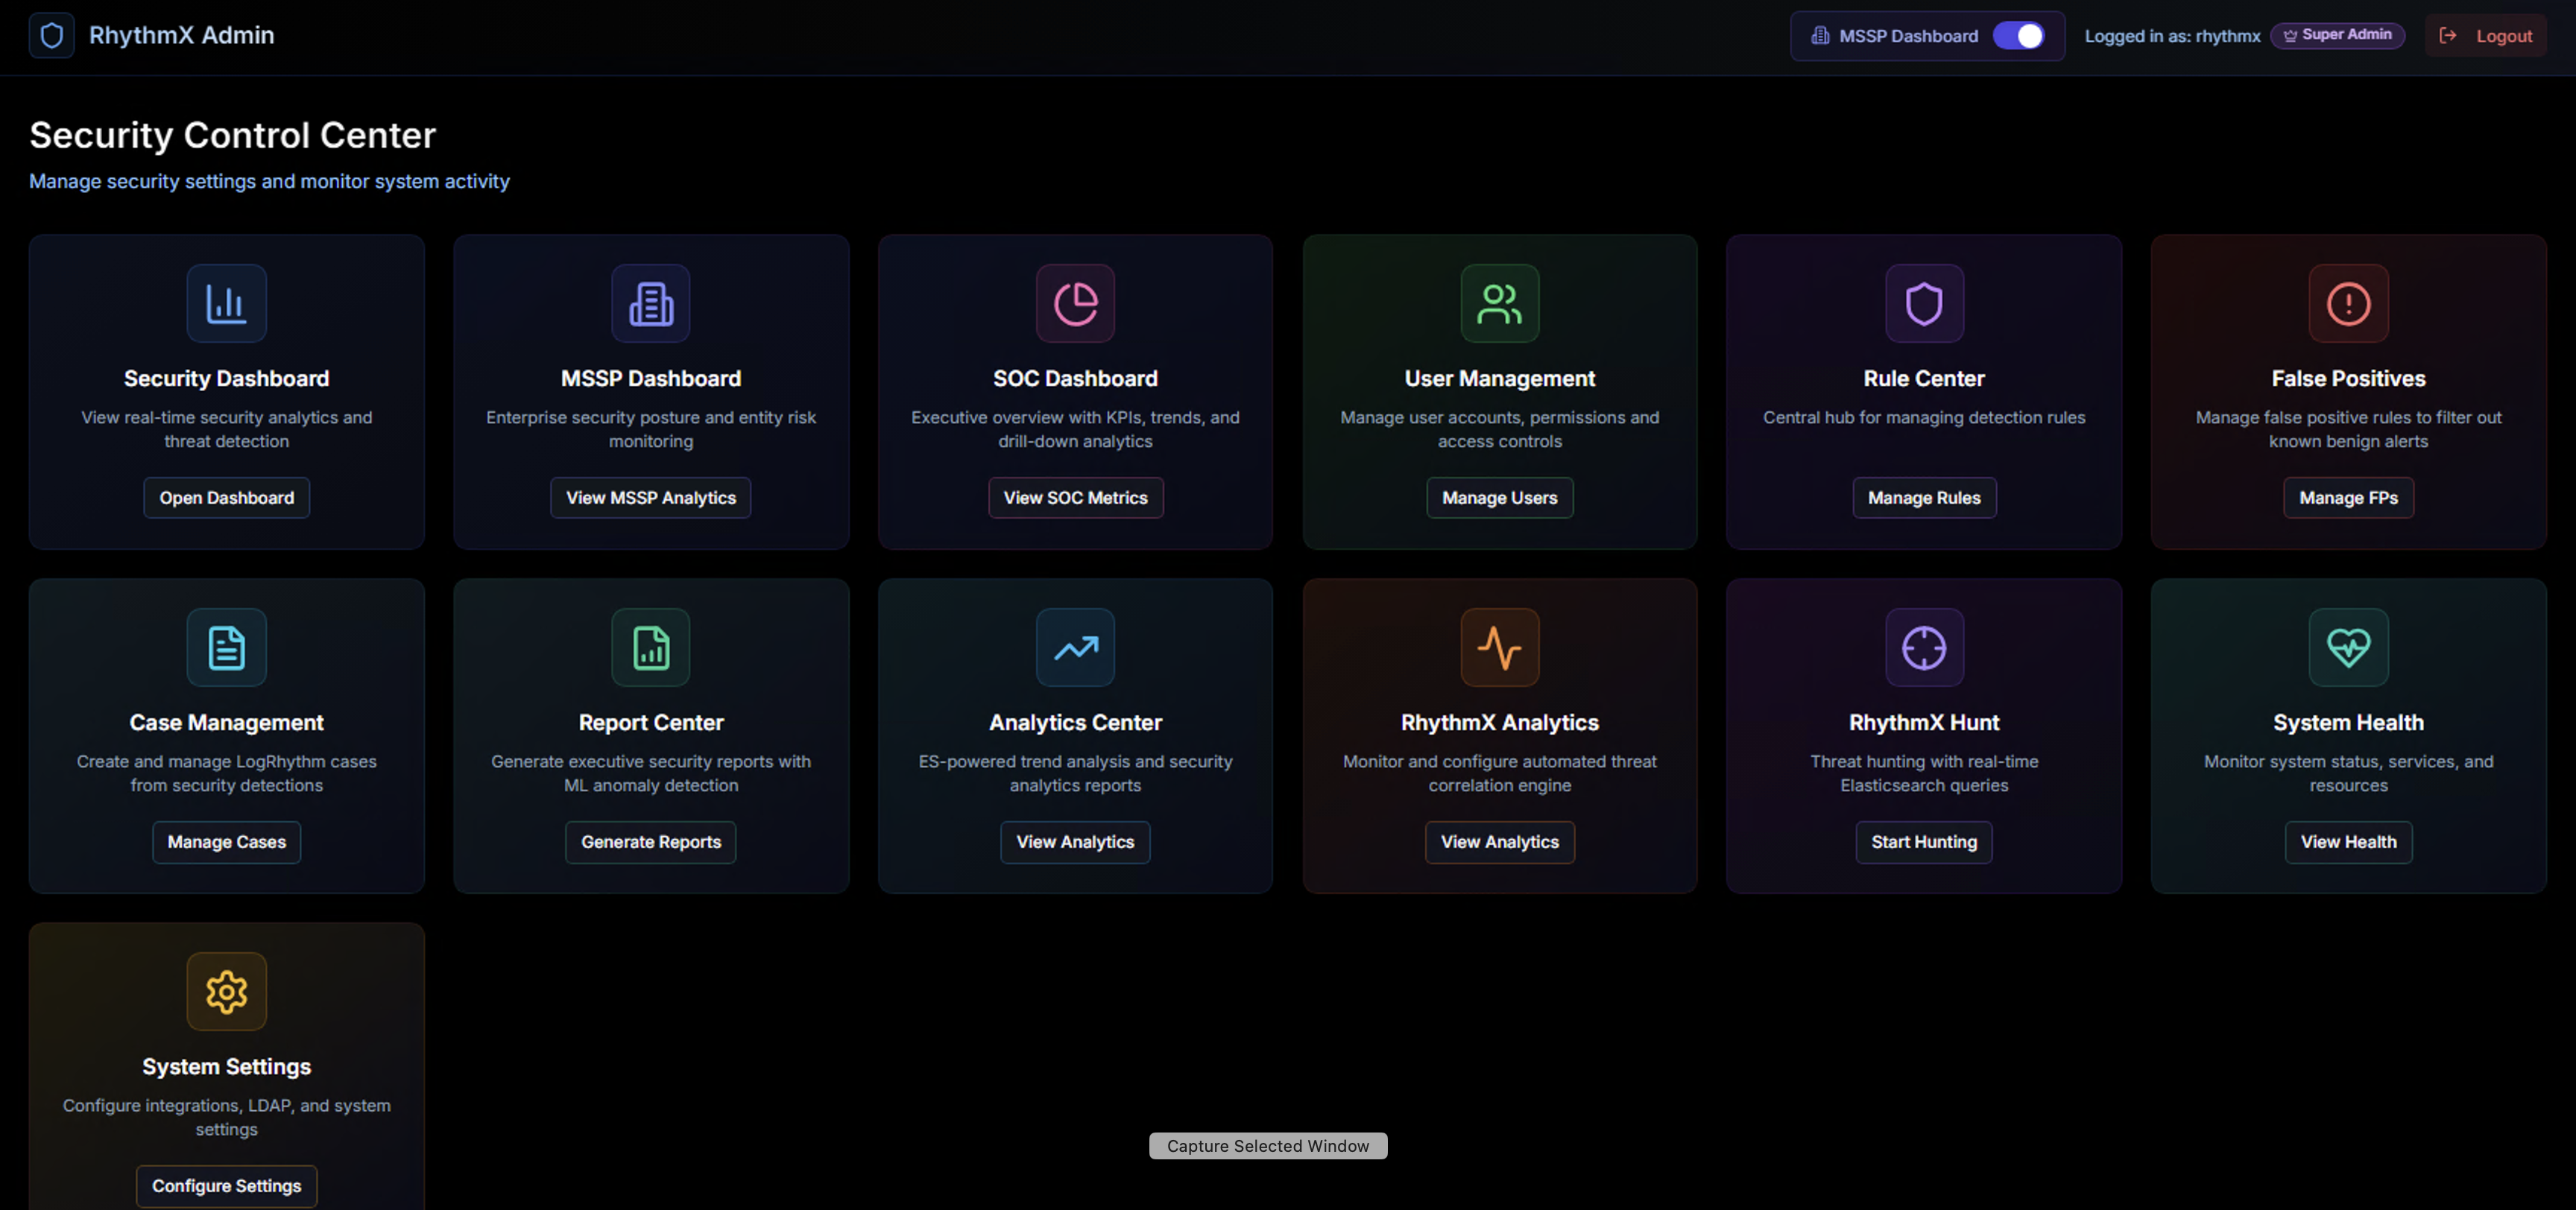
From the Security Control Center, click Manage Cases on the Case Management widget.
Case List
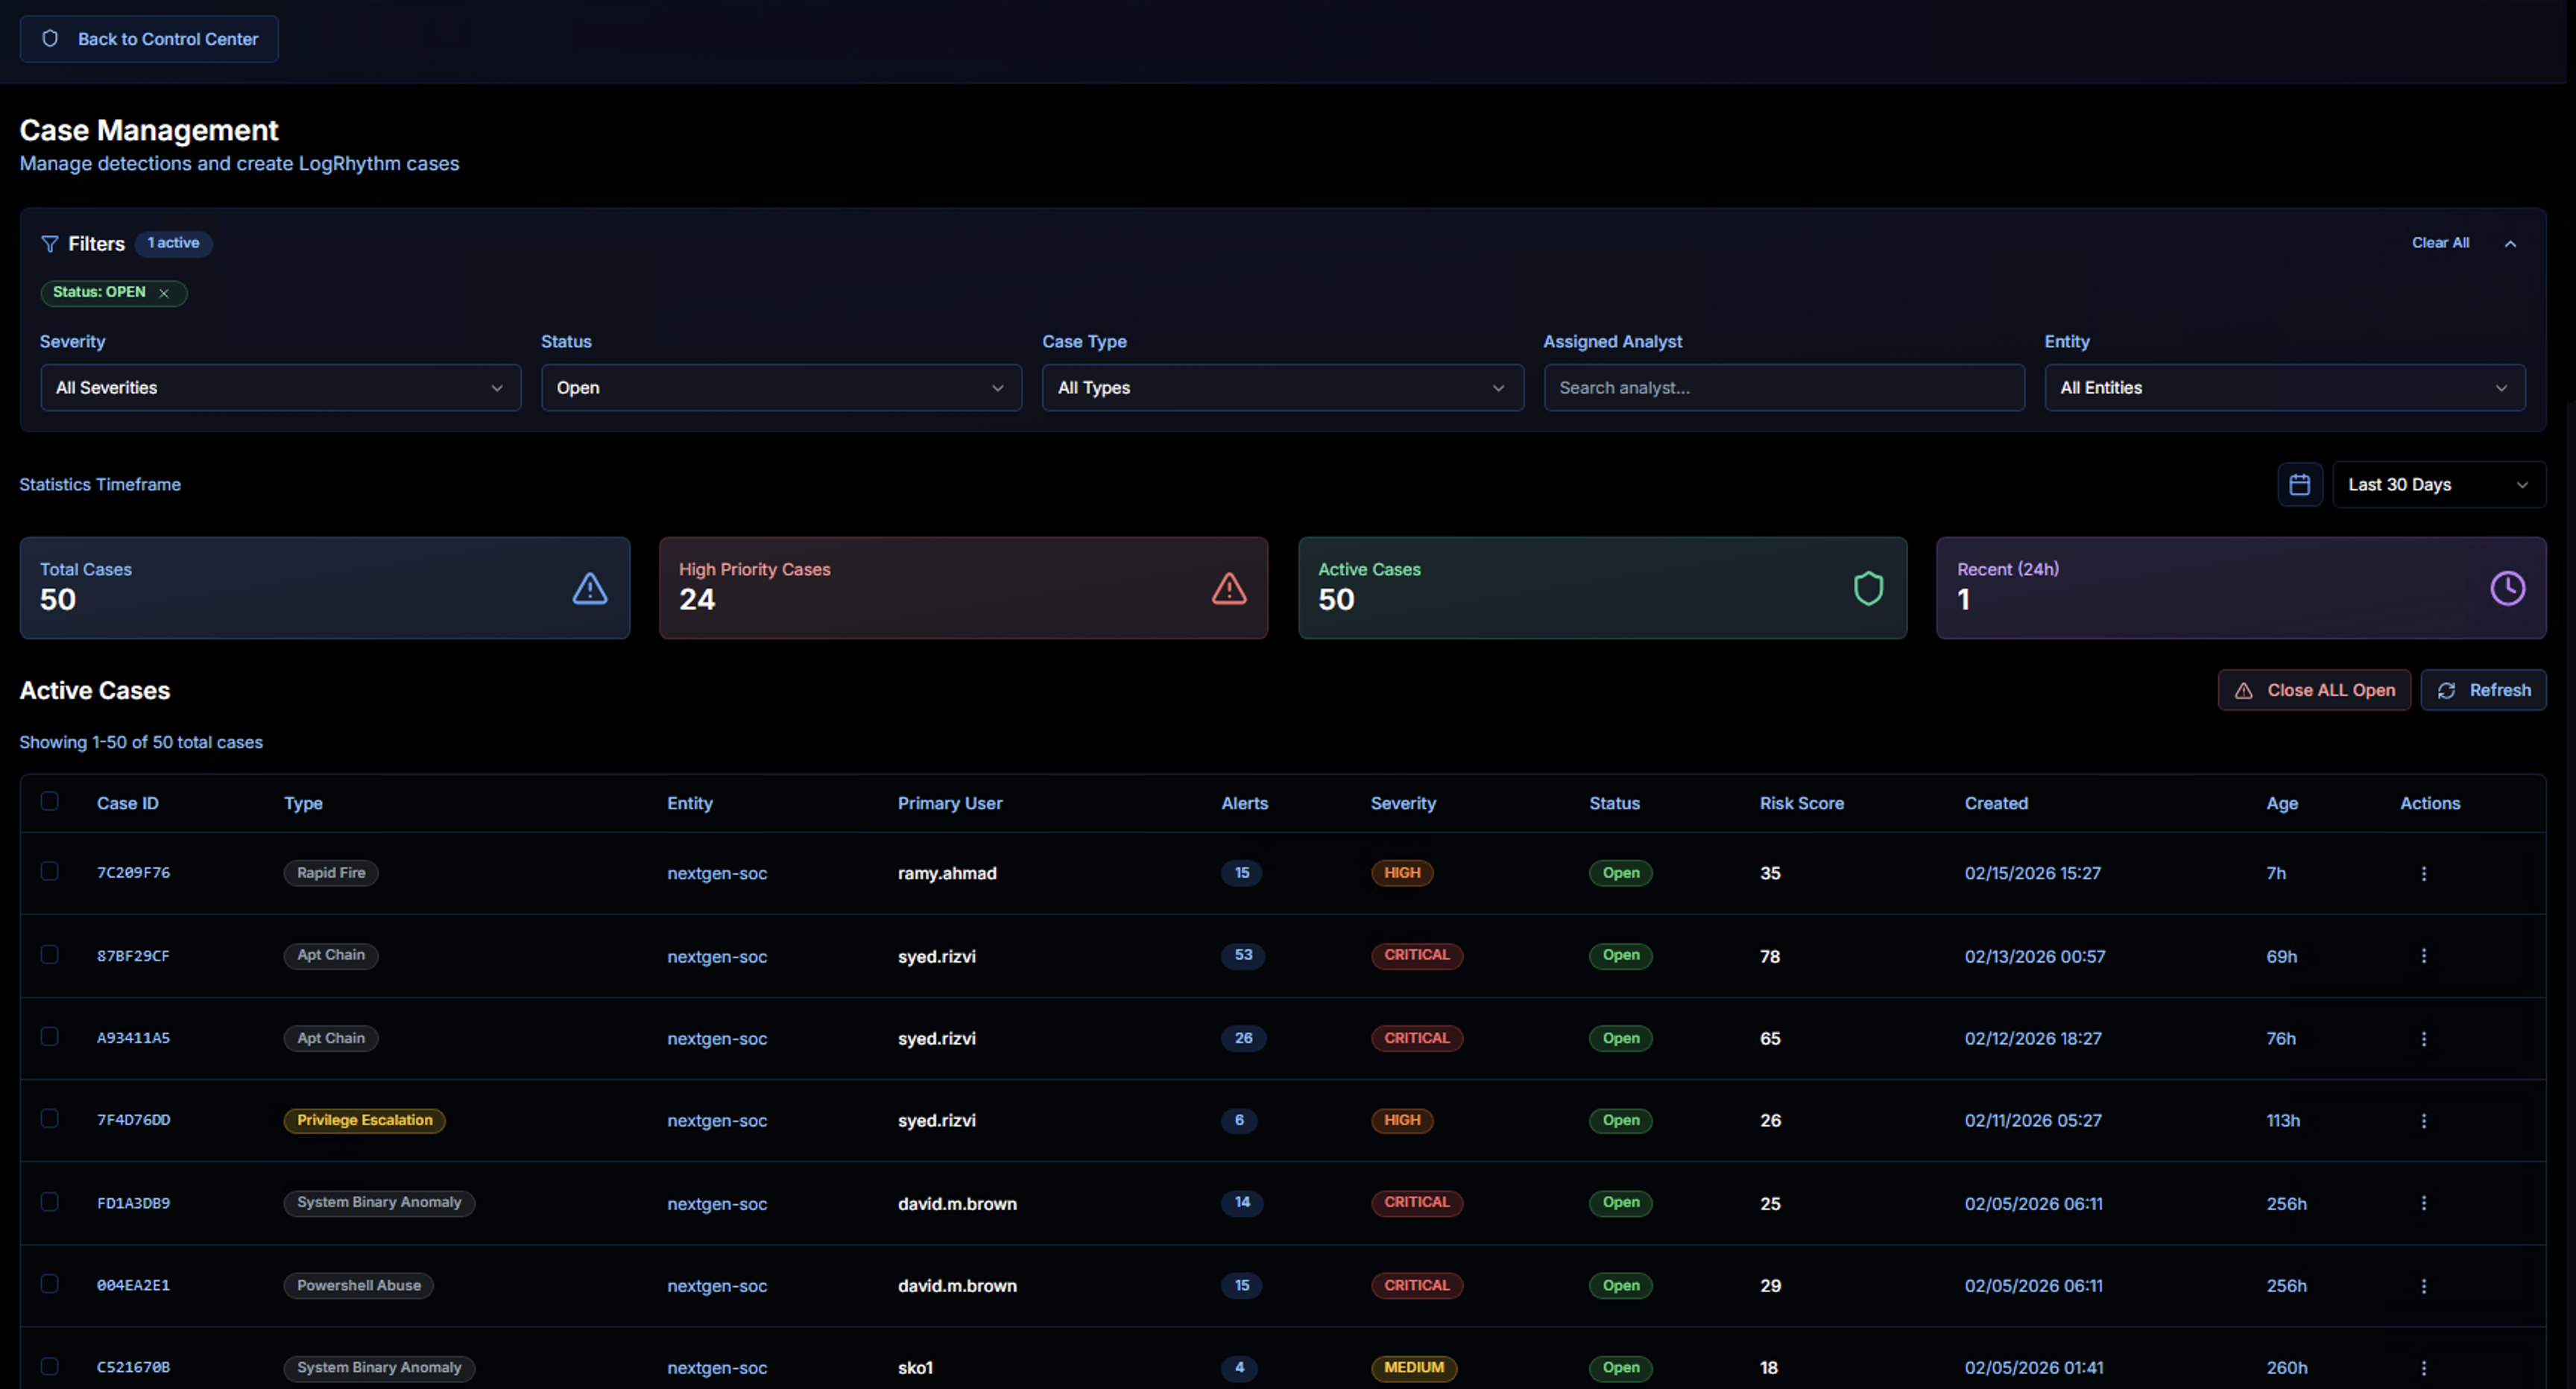
The Case Management page displays all cases with filtering, KPIs, and a sortable case table.
Filters
The filter bar at the top lets you narrow down the case list:
| Filter | Options |
|---|---|
| Severity | All Severities, Critical, High, Medium, Low |
| Status | Open, In Progress, Closed |
| Case Type | Filter by correlation use case type |
| Assigned Analyst | Search by analyst name |
| Entity | Filter by LogRhythm entity |
Active filters appear as chips below the filter bar. Click Clear All to reset.
Case Type Filter
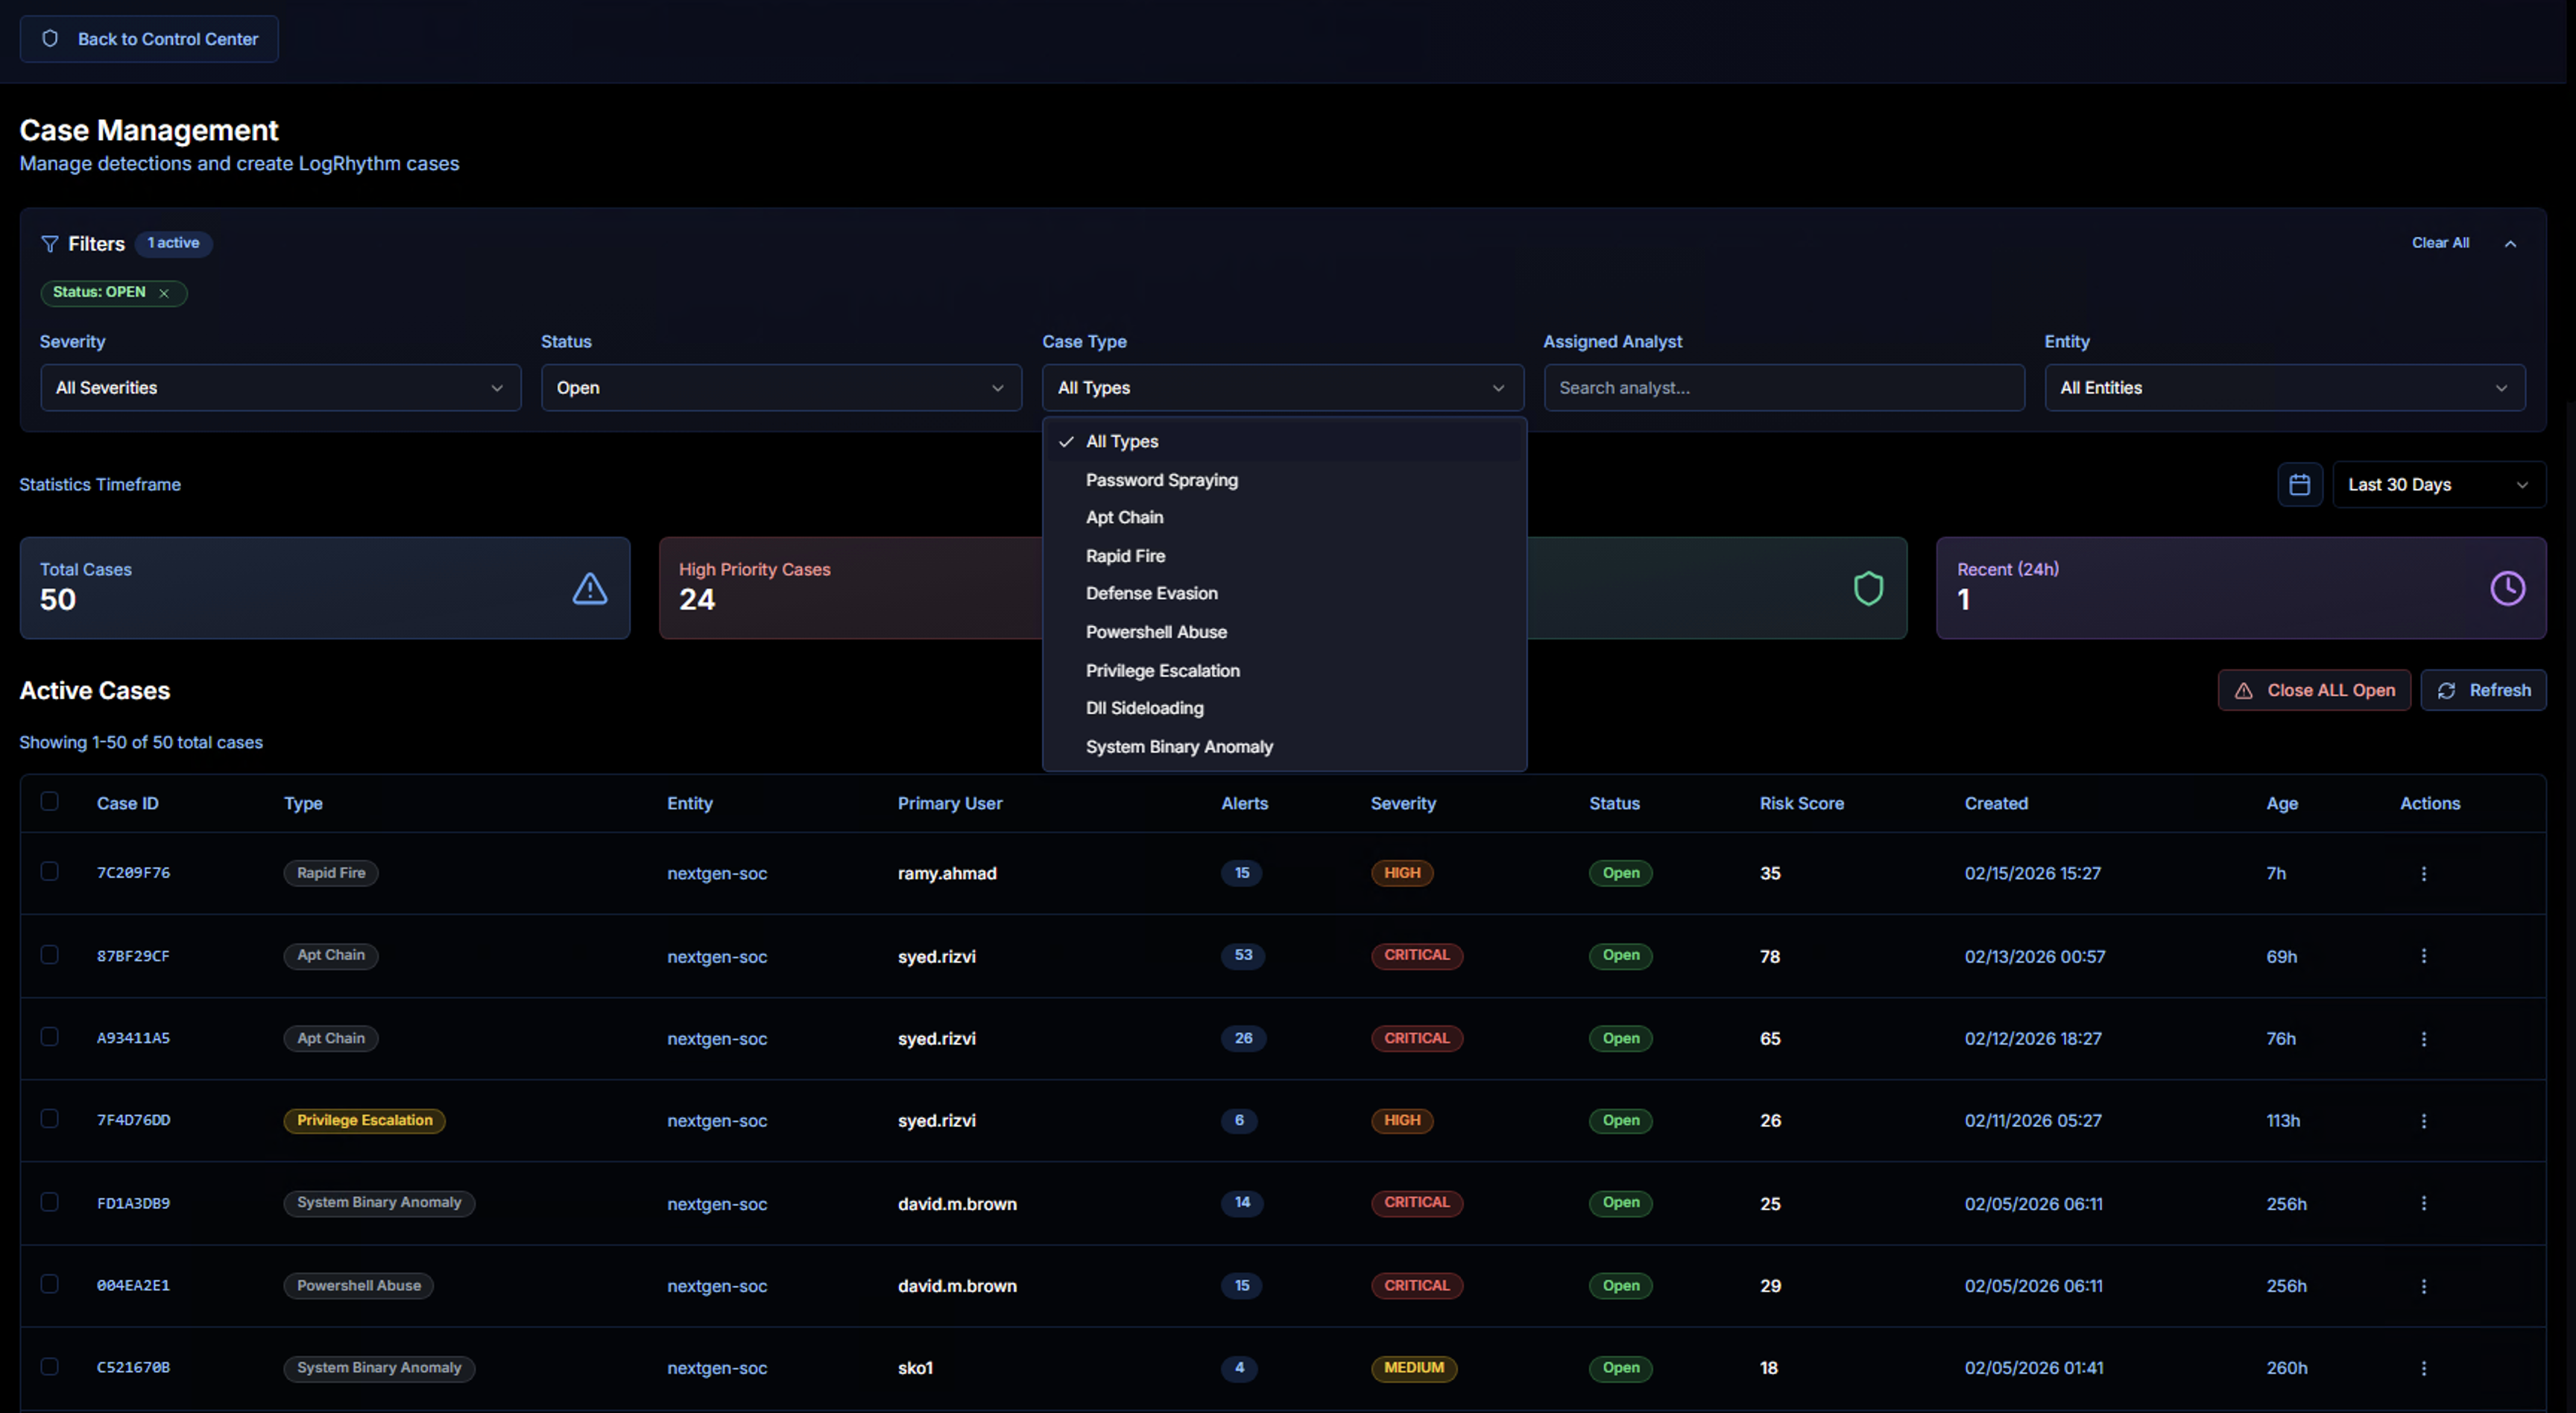
The Case Type dropdown lists all correlation use cases that have generated cases:
- Password Spraying
- Apt Chain
- Rapid Fire
- Defense Evasion
- PowerShell Abuse
- Privilege Escalation
- DLL Sideloading
- System Binary Anomaly
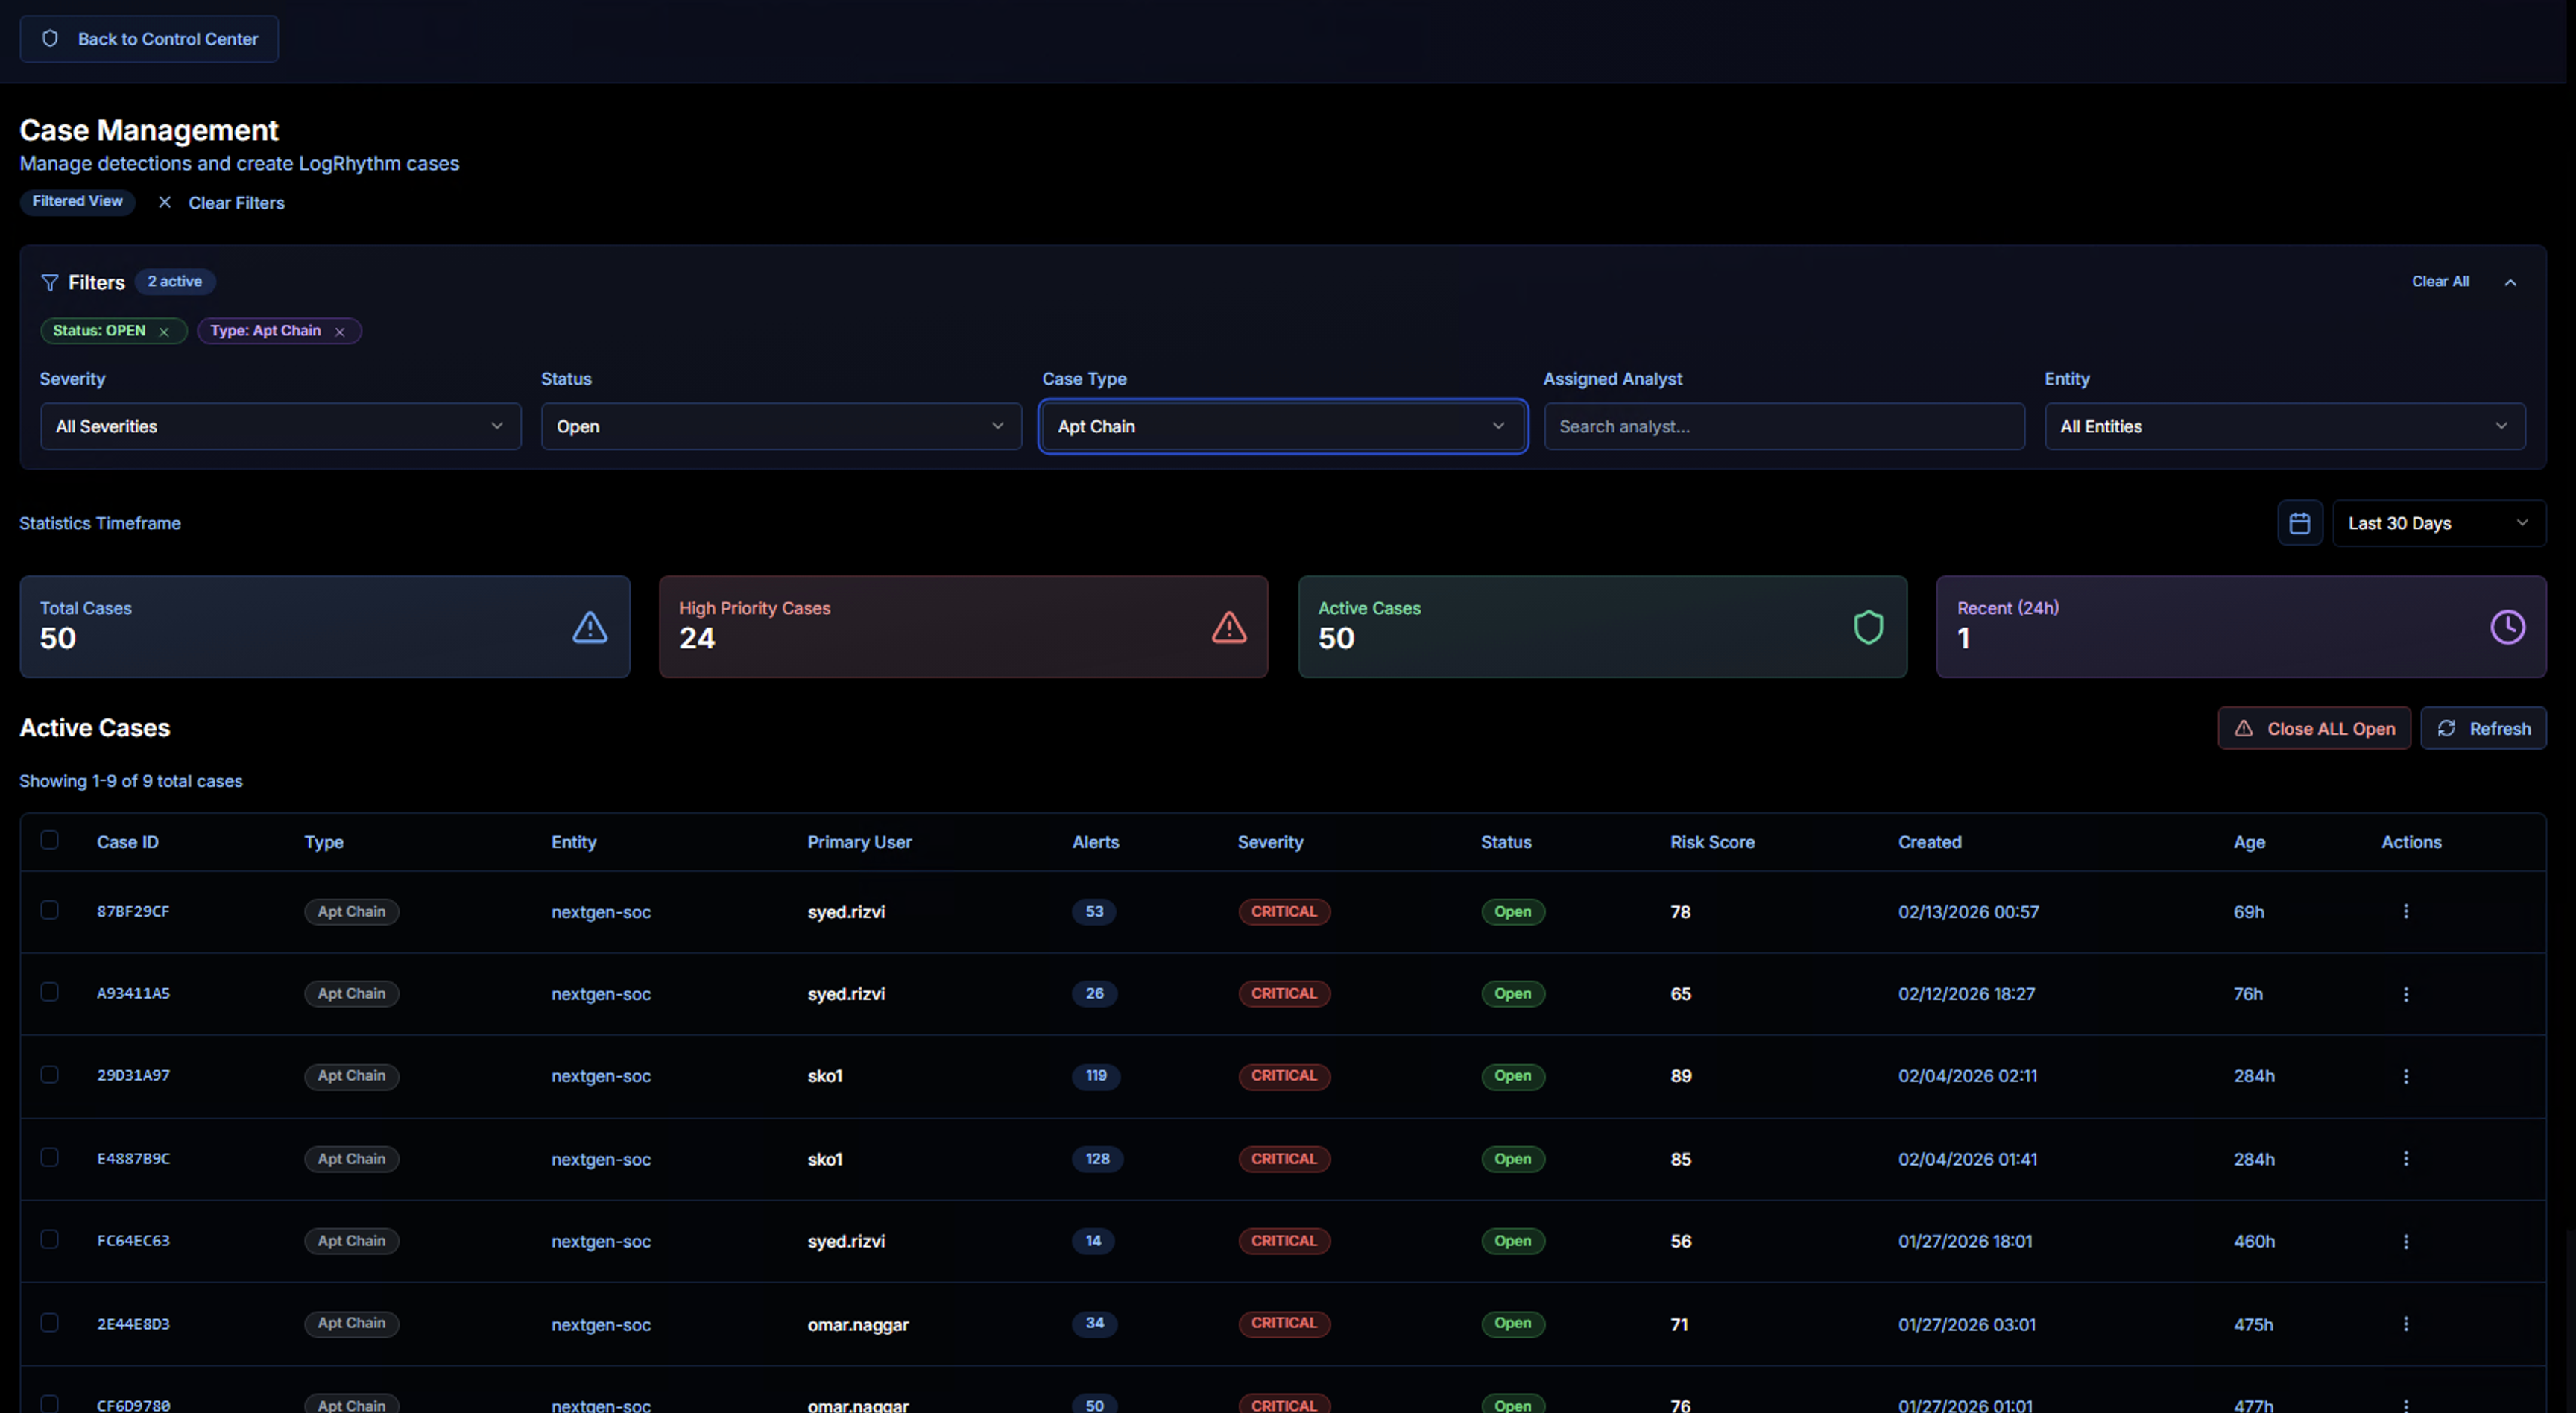
Selecting a type filters the case list to show only cases of that category.
KPIs
| KPI | Description |
|---|---|
| Total Cases | Total number of cases matching the current filters |
| High Priority Cases | Cases with Critical or High severity |
| Active Cases | Cases currently in Open or In Progress status |
| Recent (24h) | Cases created in the last 24 hours |
Use the Statistics Timeframe control to adjust the KPI reporting period (e.g., Last 30 Days).
Case Table
| Column | Description |
|---|---|
| Case ID | Unique case identifier |
| Type | Correlation use case that generated the case (e.g., Rapid Fire, Apt Chain, Privilege Escalation, System Binary Anomaly, PowerShell Abuse) |
| Entity | The LogRhythm entity where the activity was detected |
| Primary User | The user account most associated with the case activity |
| Alerts | Number of correlated alerts in the case |
| Severity | Critical, High, or Medium — color-coded badges |
| Status | Open, In Progress, or Closed |
| Risk Score | Calculated risk score based on alert severity and volume |
| Created | When the case was generated |
| Age | How long the case has been open |
| Actions | Context menu for case operations |
Case Actions
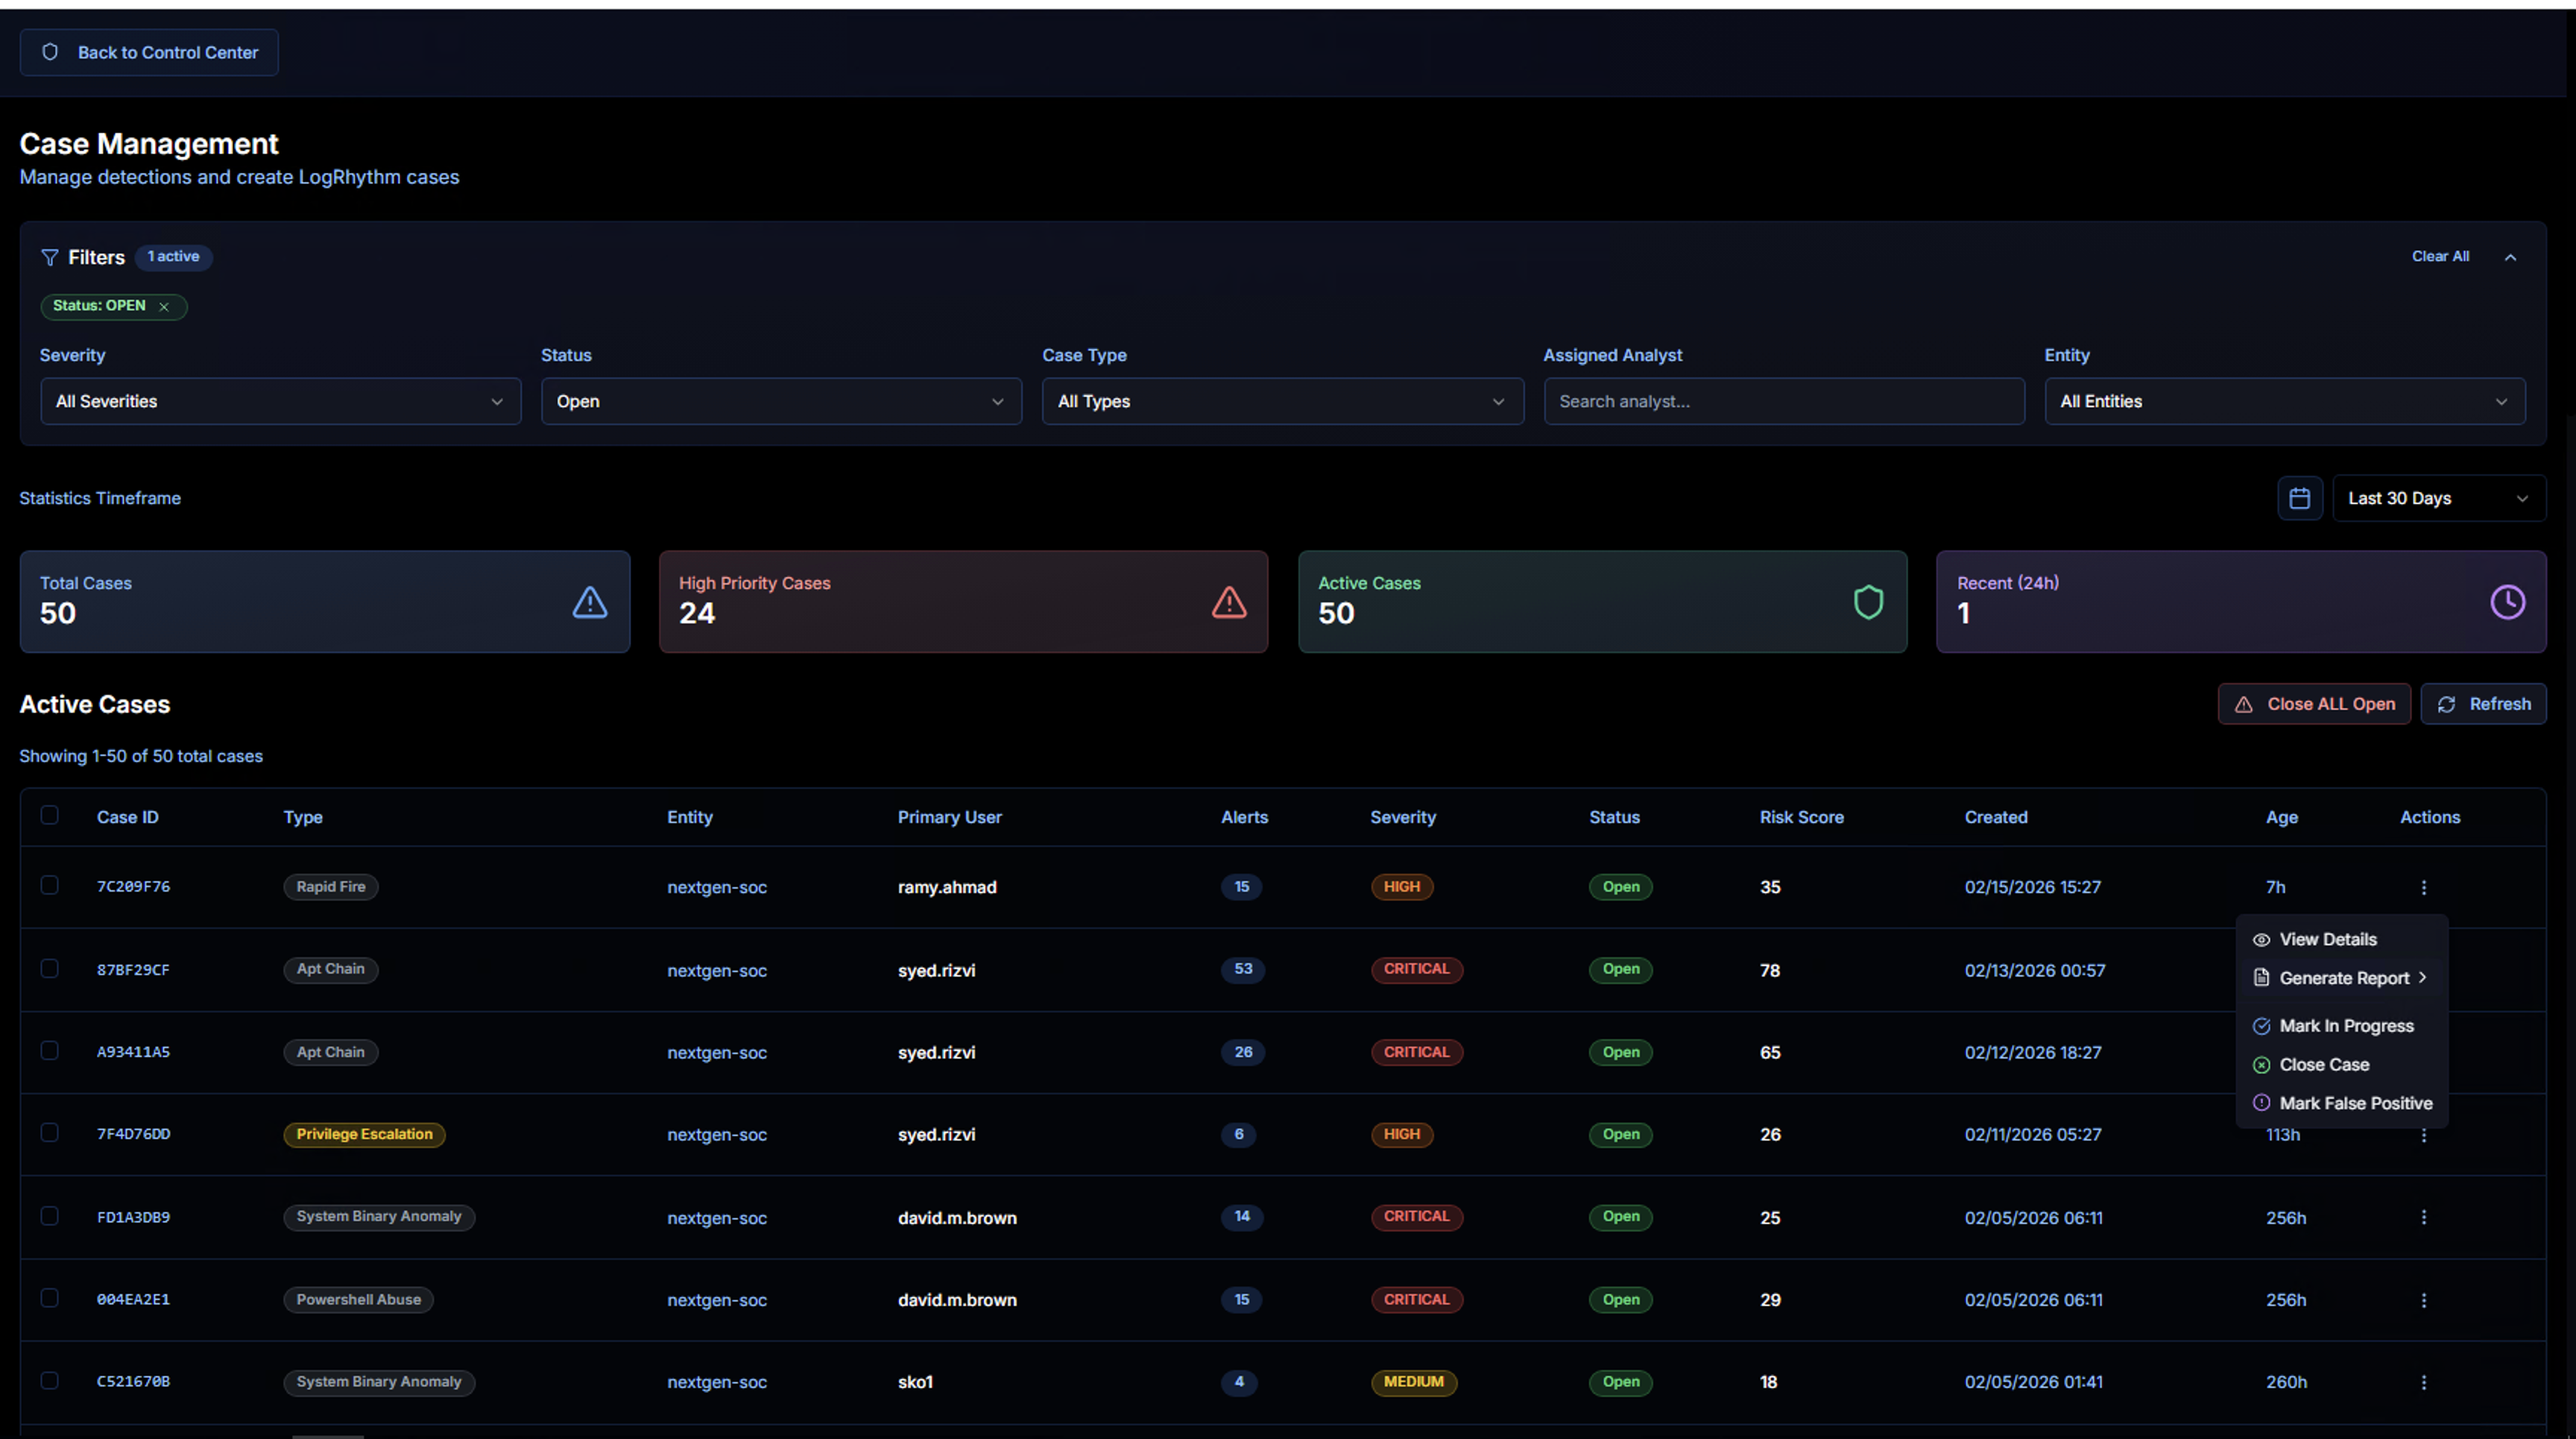
Click the actions menu (three dots) on any case row to access:
| Action | Description |
|---|---|
| View Details | Open the full case detail view |
| Generate Report | Export the case as a downloadable report |
| Mark In Progress | Change the case status to In Progress (indicates an analyst is actively working on it) |
| Close Case | Mark the case as resolved and closed |
| Mark False Positive | Mark the entire case as a false positive |
Use Close ALL Open to bulk-close all open cases, or Refresh to update the list.
Case Detail View
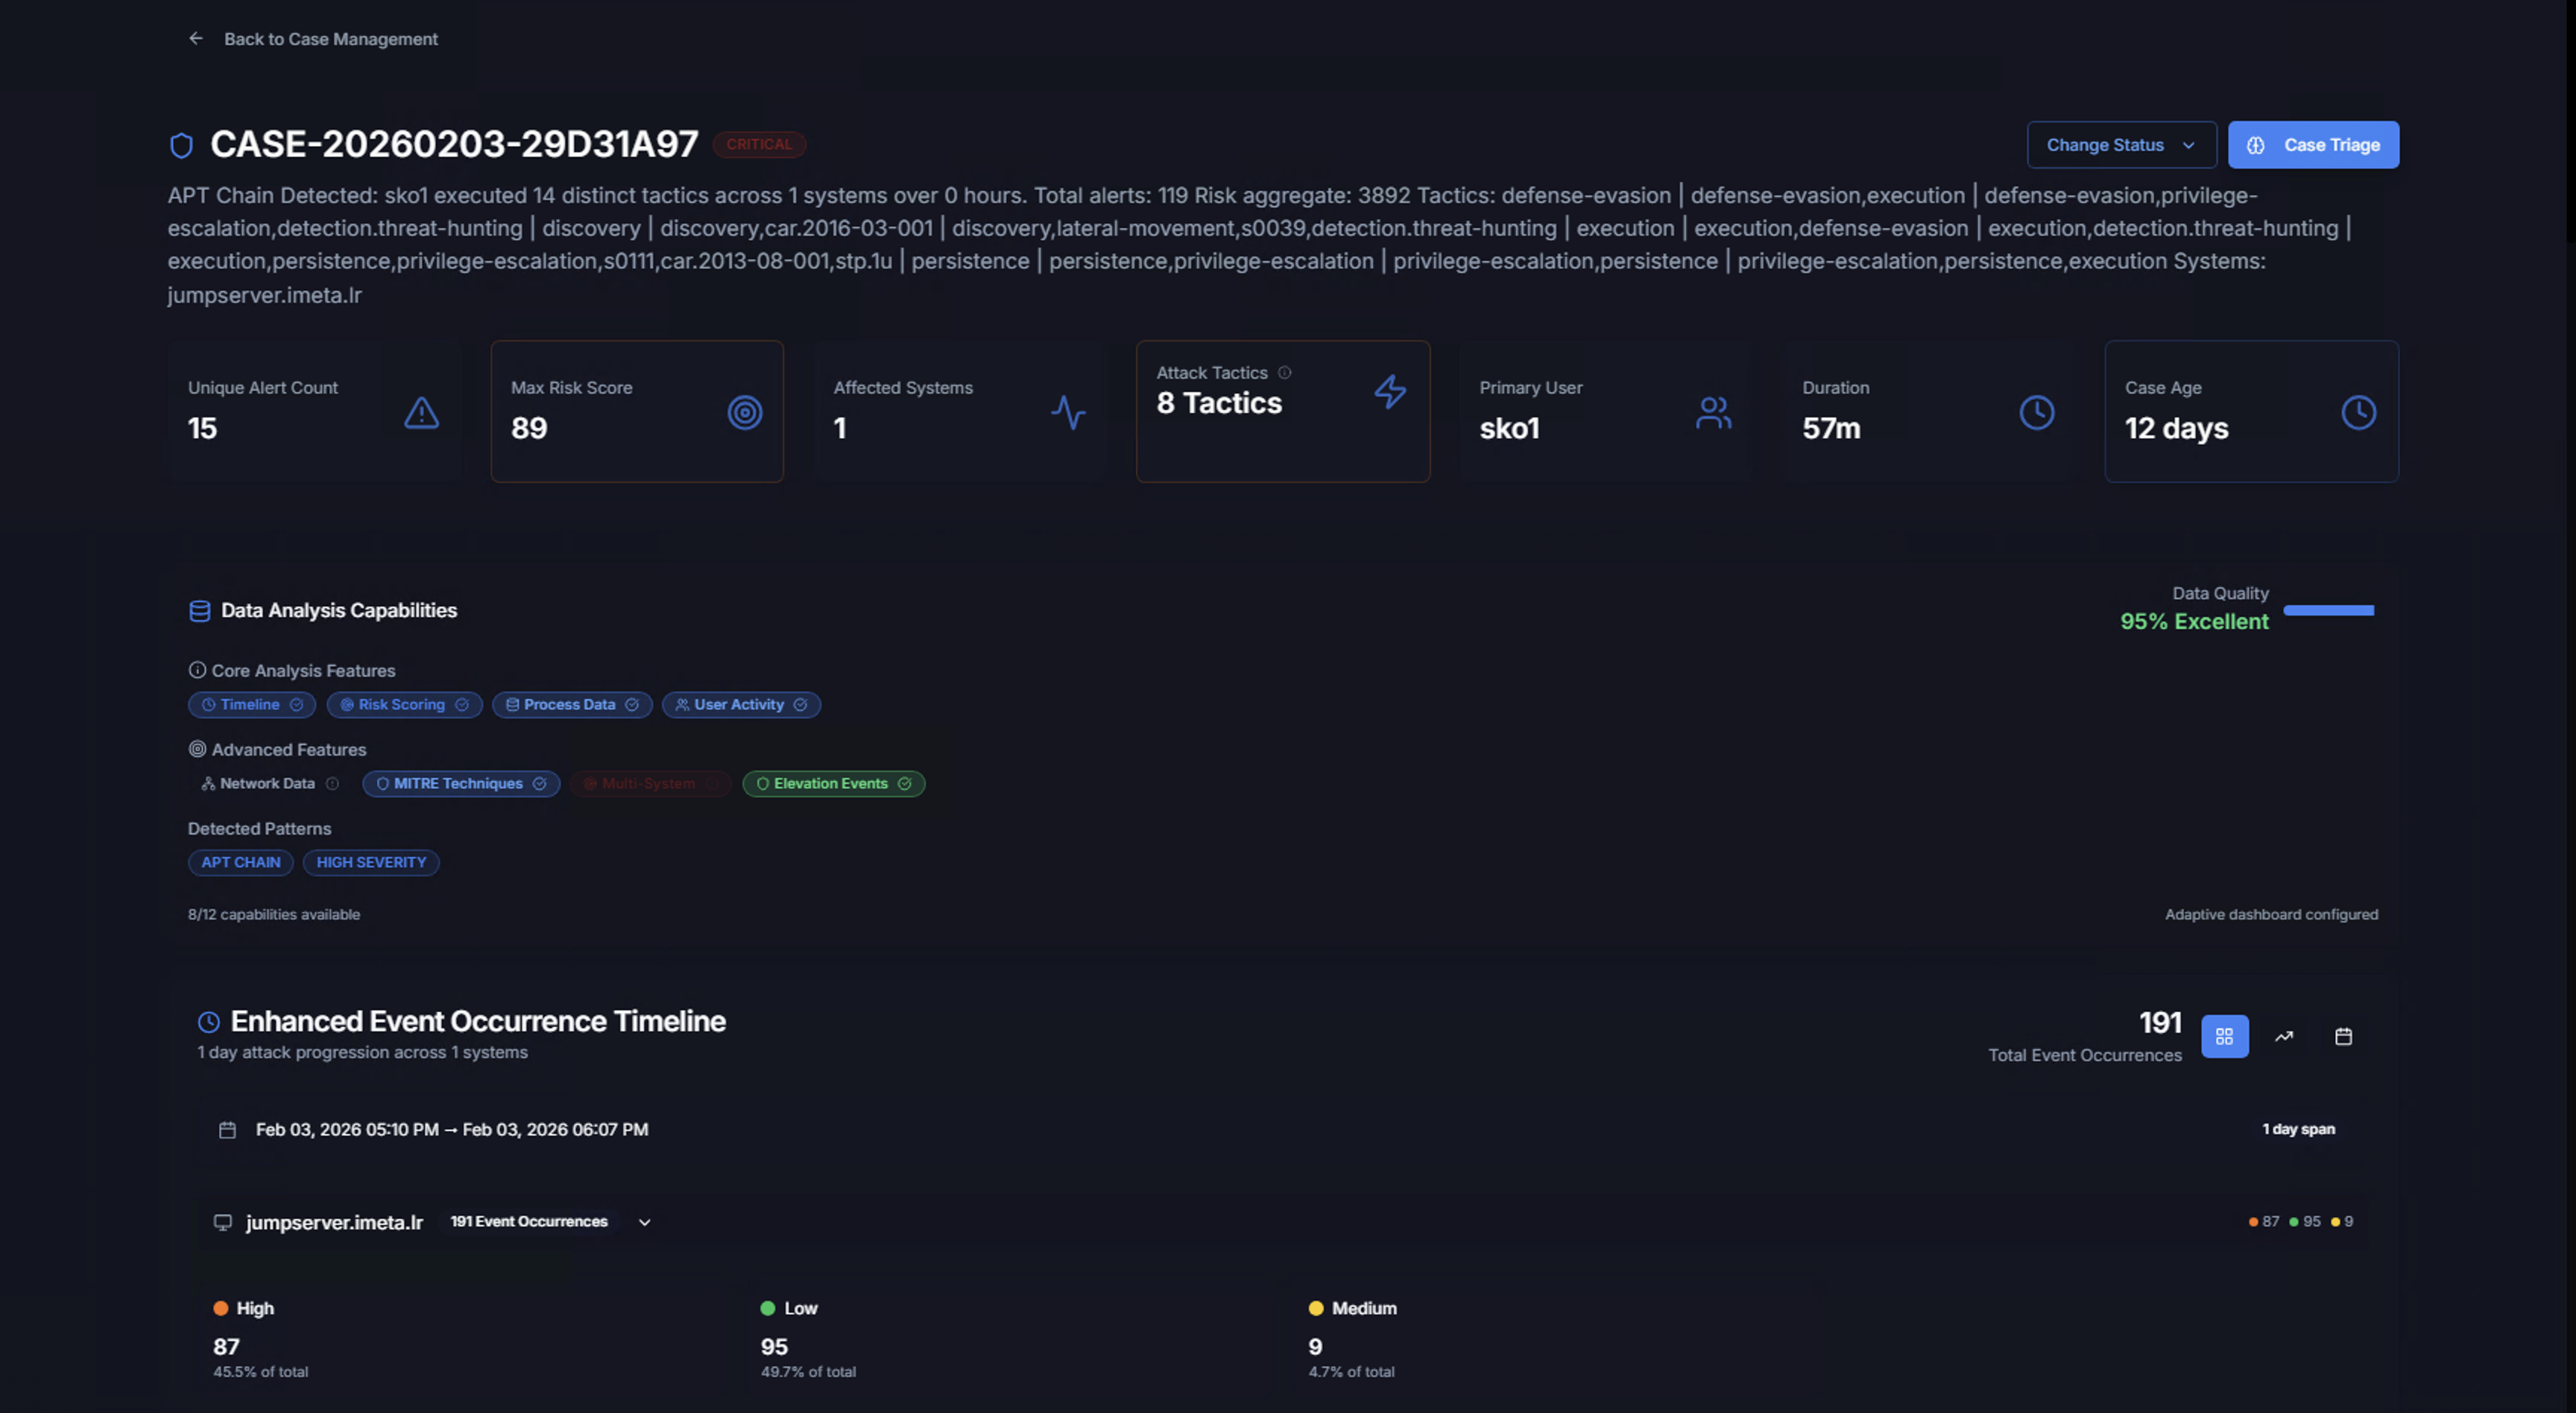
Clicking View Details on a case opens the full investigation view. The case header shows:
- Case ID and severity badge — e.g., CASE-20260203-29D31A97 (CRITICAL)
- Case description — Full text describing what was detected, including tactics, techniques, discovery methods, and affected systems
- Back to Case Management link to return to the case list
Case KPIs
| KPI | Description |
|---|---|
| Unique Alert Count | Number of distinct Sigma rules that triggered in this case |
| Max Risk Score | The highest risk score among all correlated alerts |
| Affected Systems | Number of unique systems involved |
| Attack Tactics | Number of MITRE ATT&CK tactics observed — click to see the full tactic breakdown |
| Primary User | The user account most associated with the case |
| Duration | Total time span from first to last alert |
| Case Age | How long since the case was created |
MITRE ATT&CK Tactics
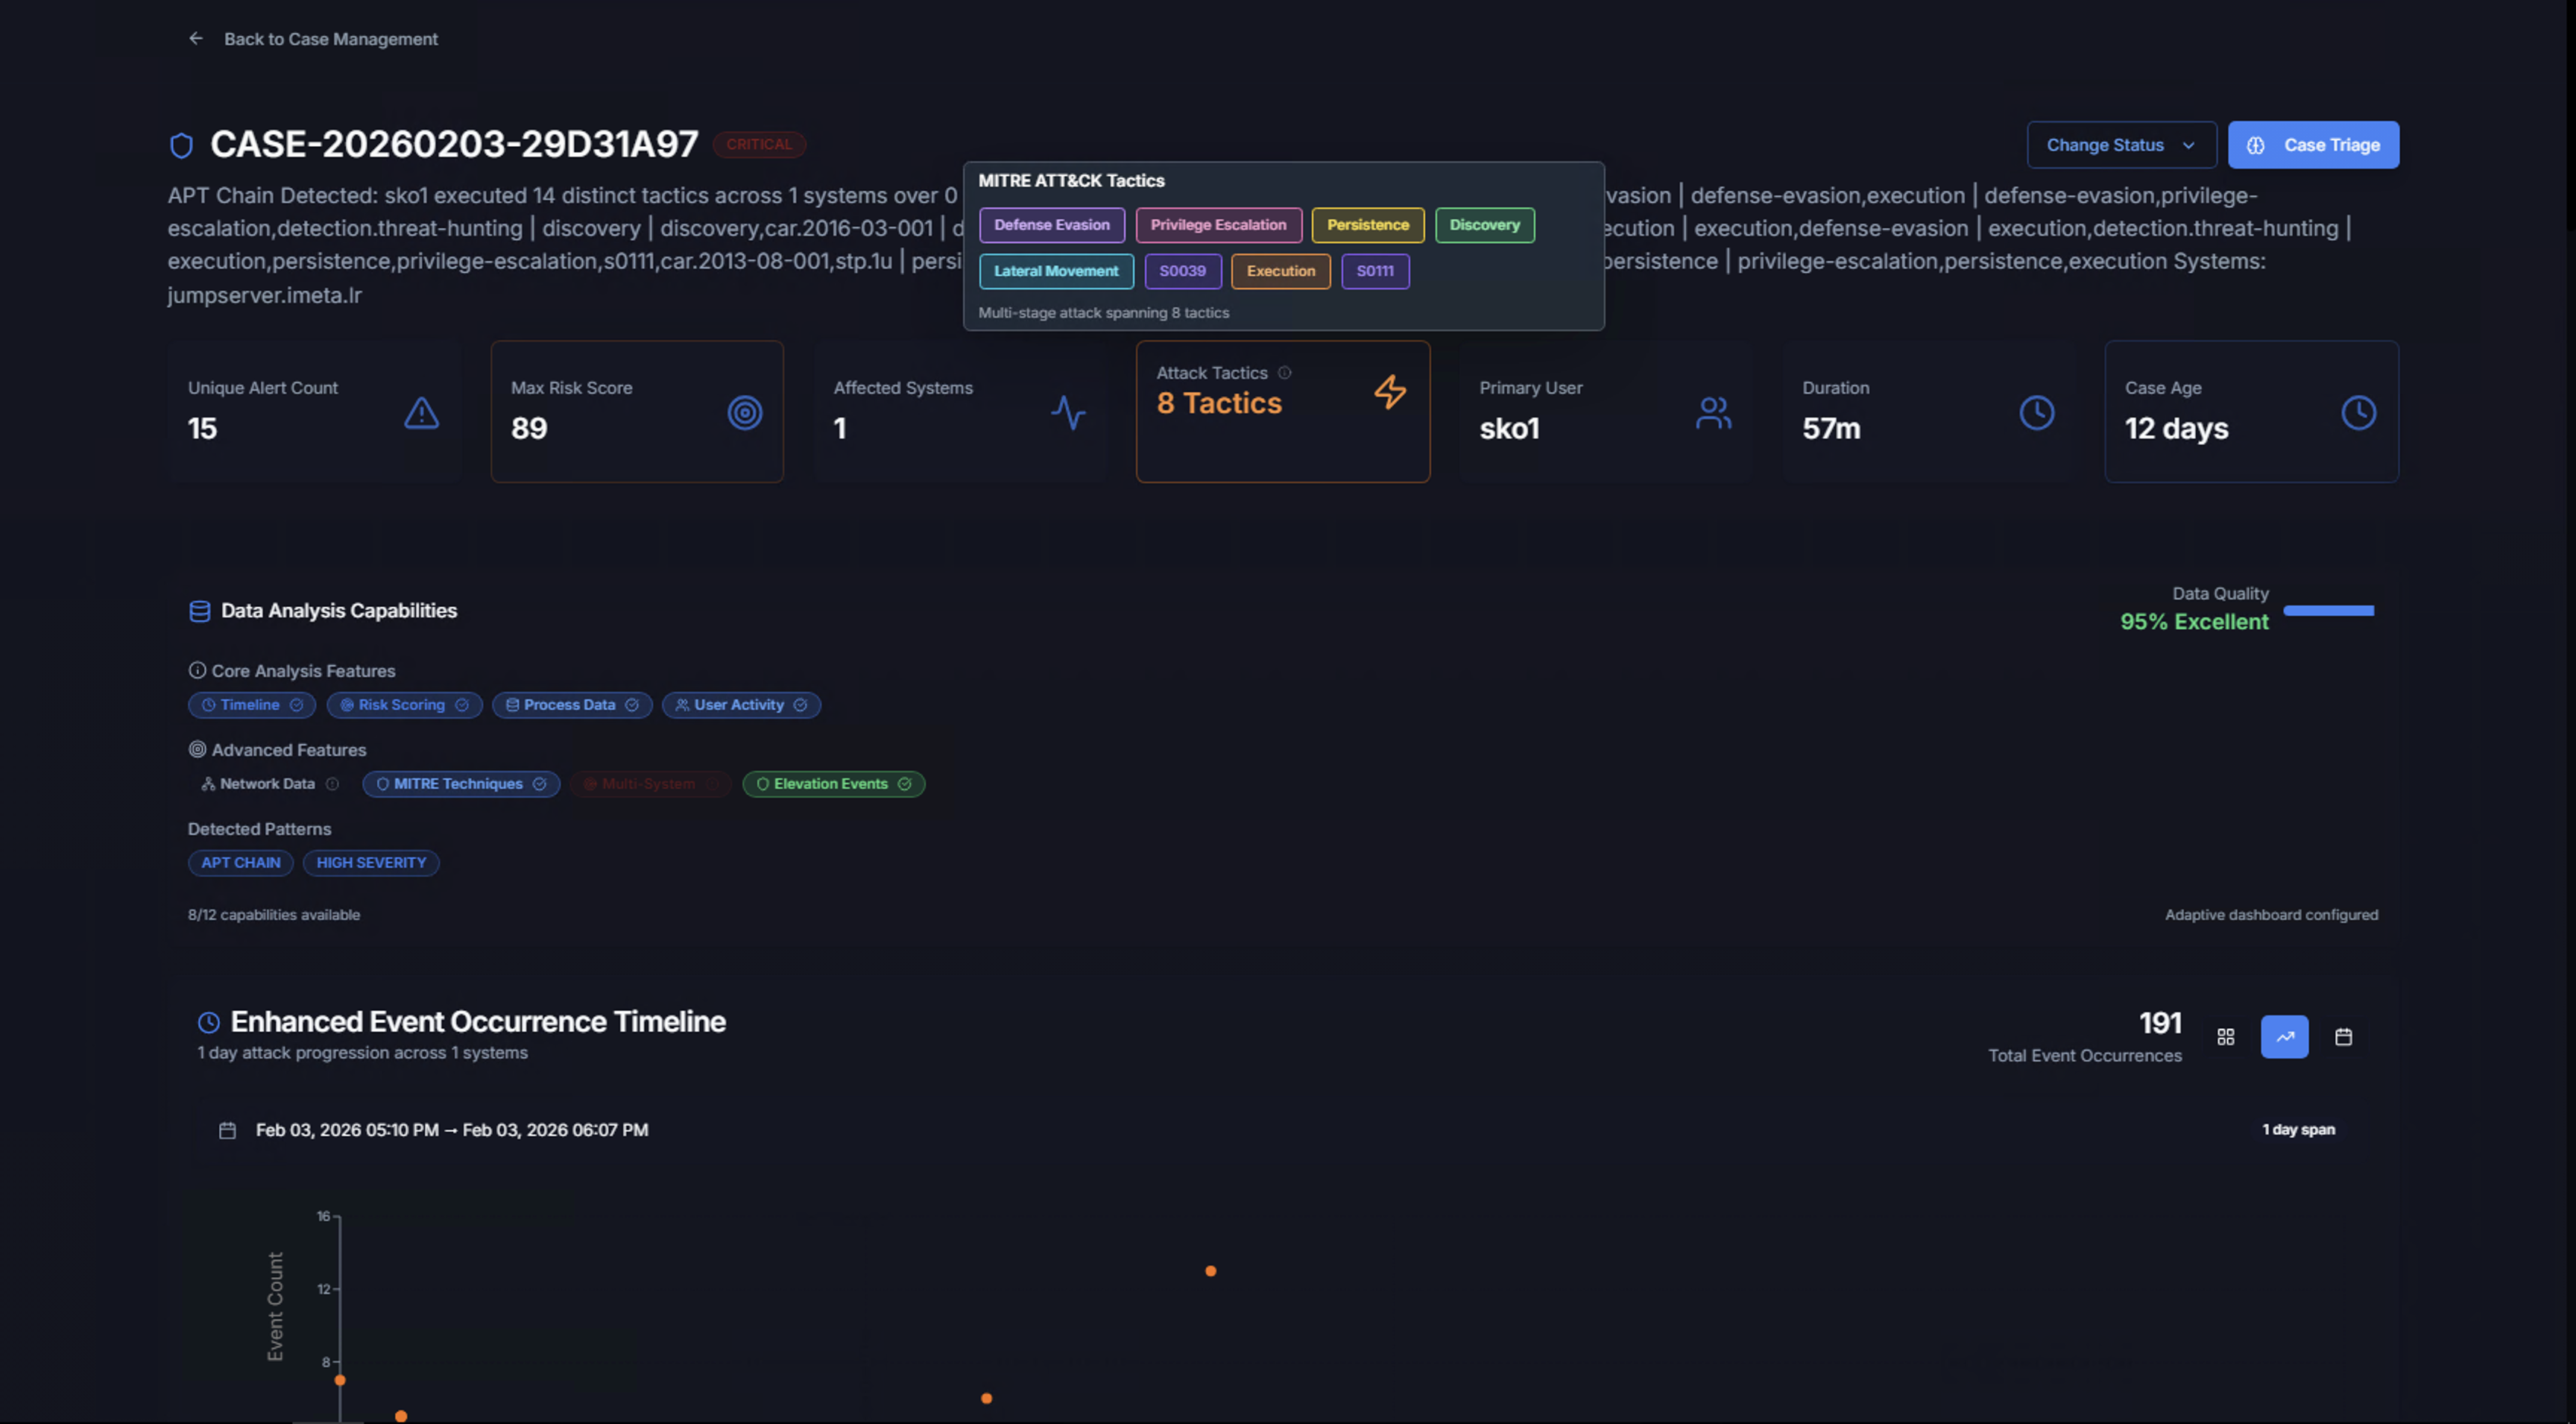
Click the Attack Tactics KPI to see all mapped MITRE ATT&CK tactics as color-coded badges (e.g., Defense Evasion, Privilege Escalation, Persistence, Discovery, Lateral Movement, Execution). This shows the breadth of the attack across the kill chain.
Change Status
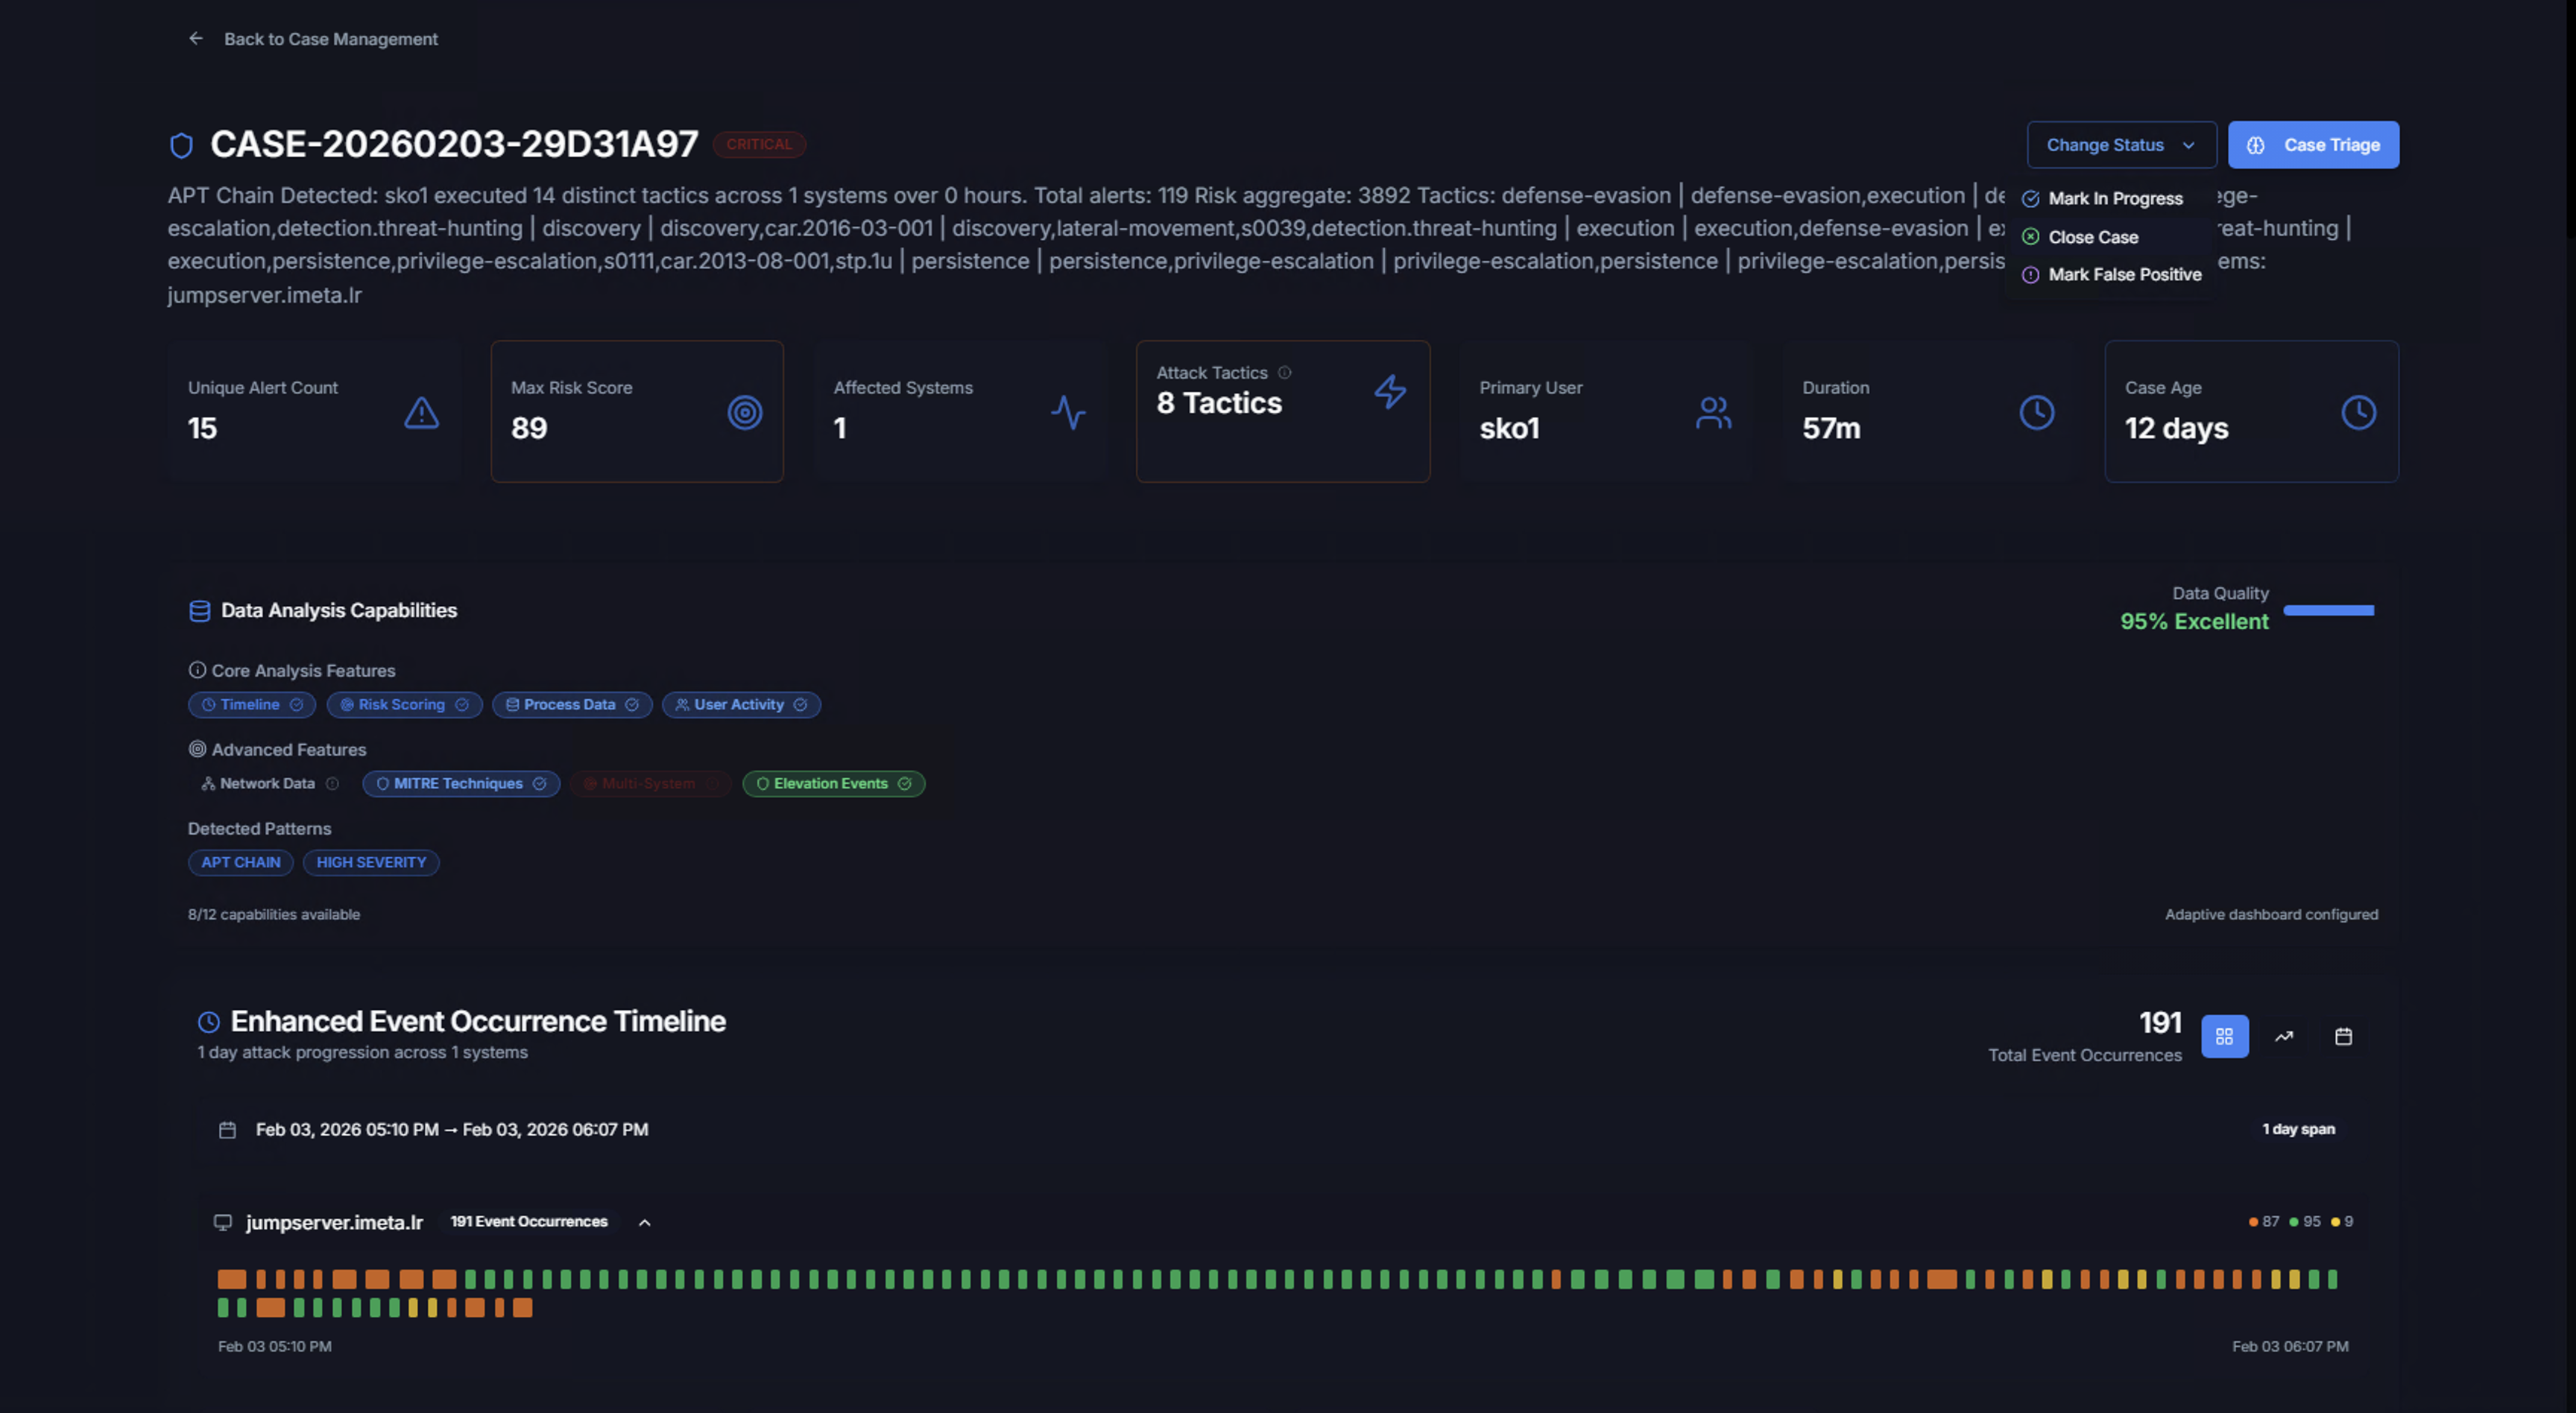
Click Change Status in the top-right to update the case:
| Option | Description |
|---|---|
| Mark In Progress | Assign the case as actively being investigated |
| Close Case | Resolve and close the case |
| Add Hunting | Create a hunting task linked to this case |
| Mark False Positive | Mark the entire case as a false positive |
Click Case Triage to launch the AI-powered analysis for this case.
Data Analysis Capabilities
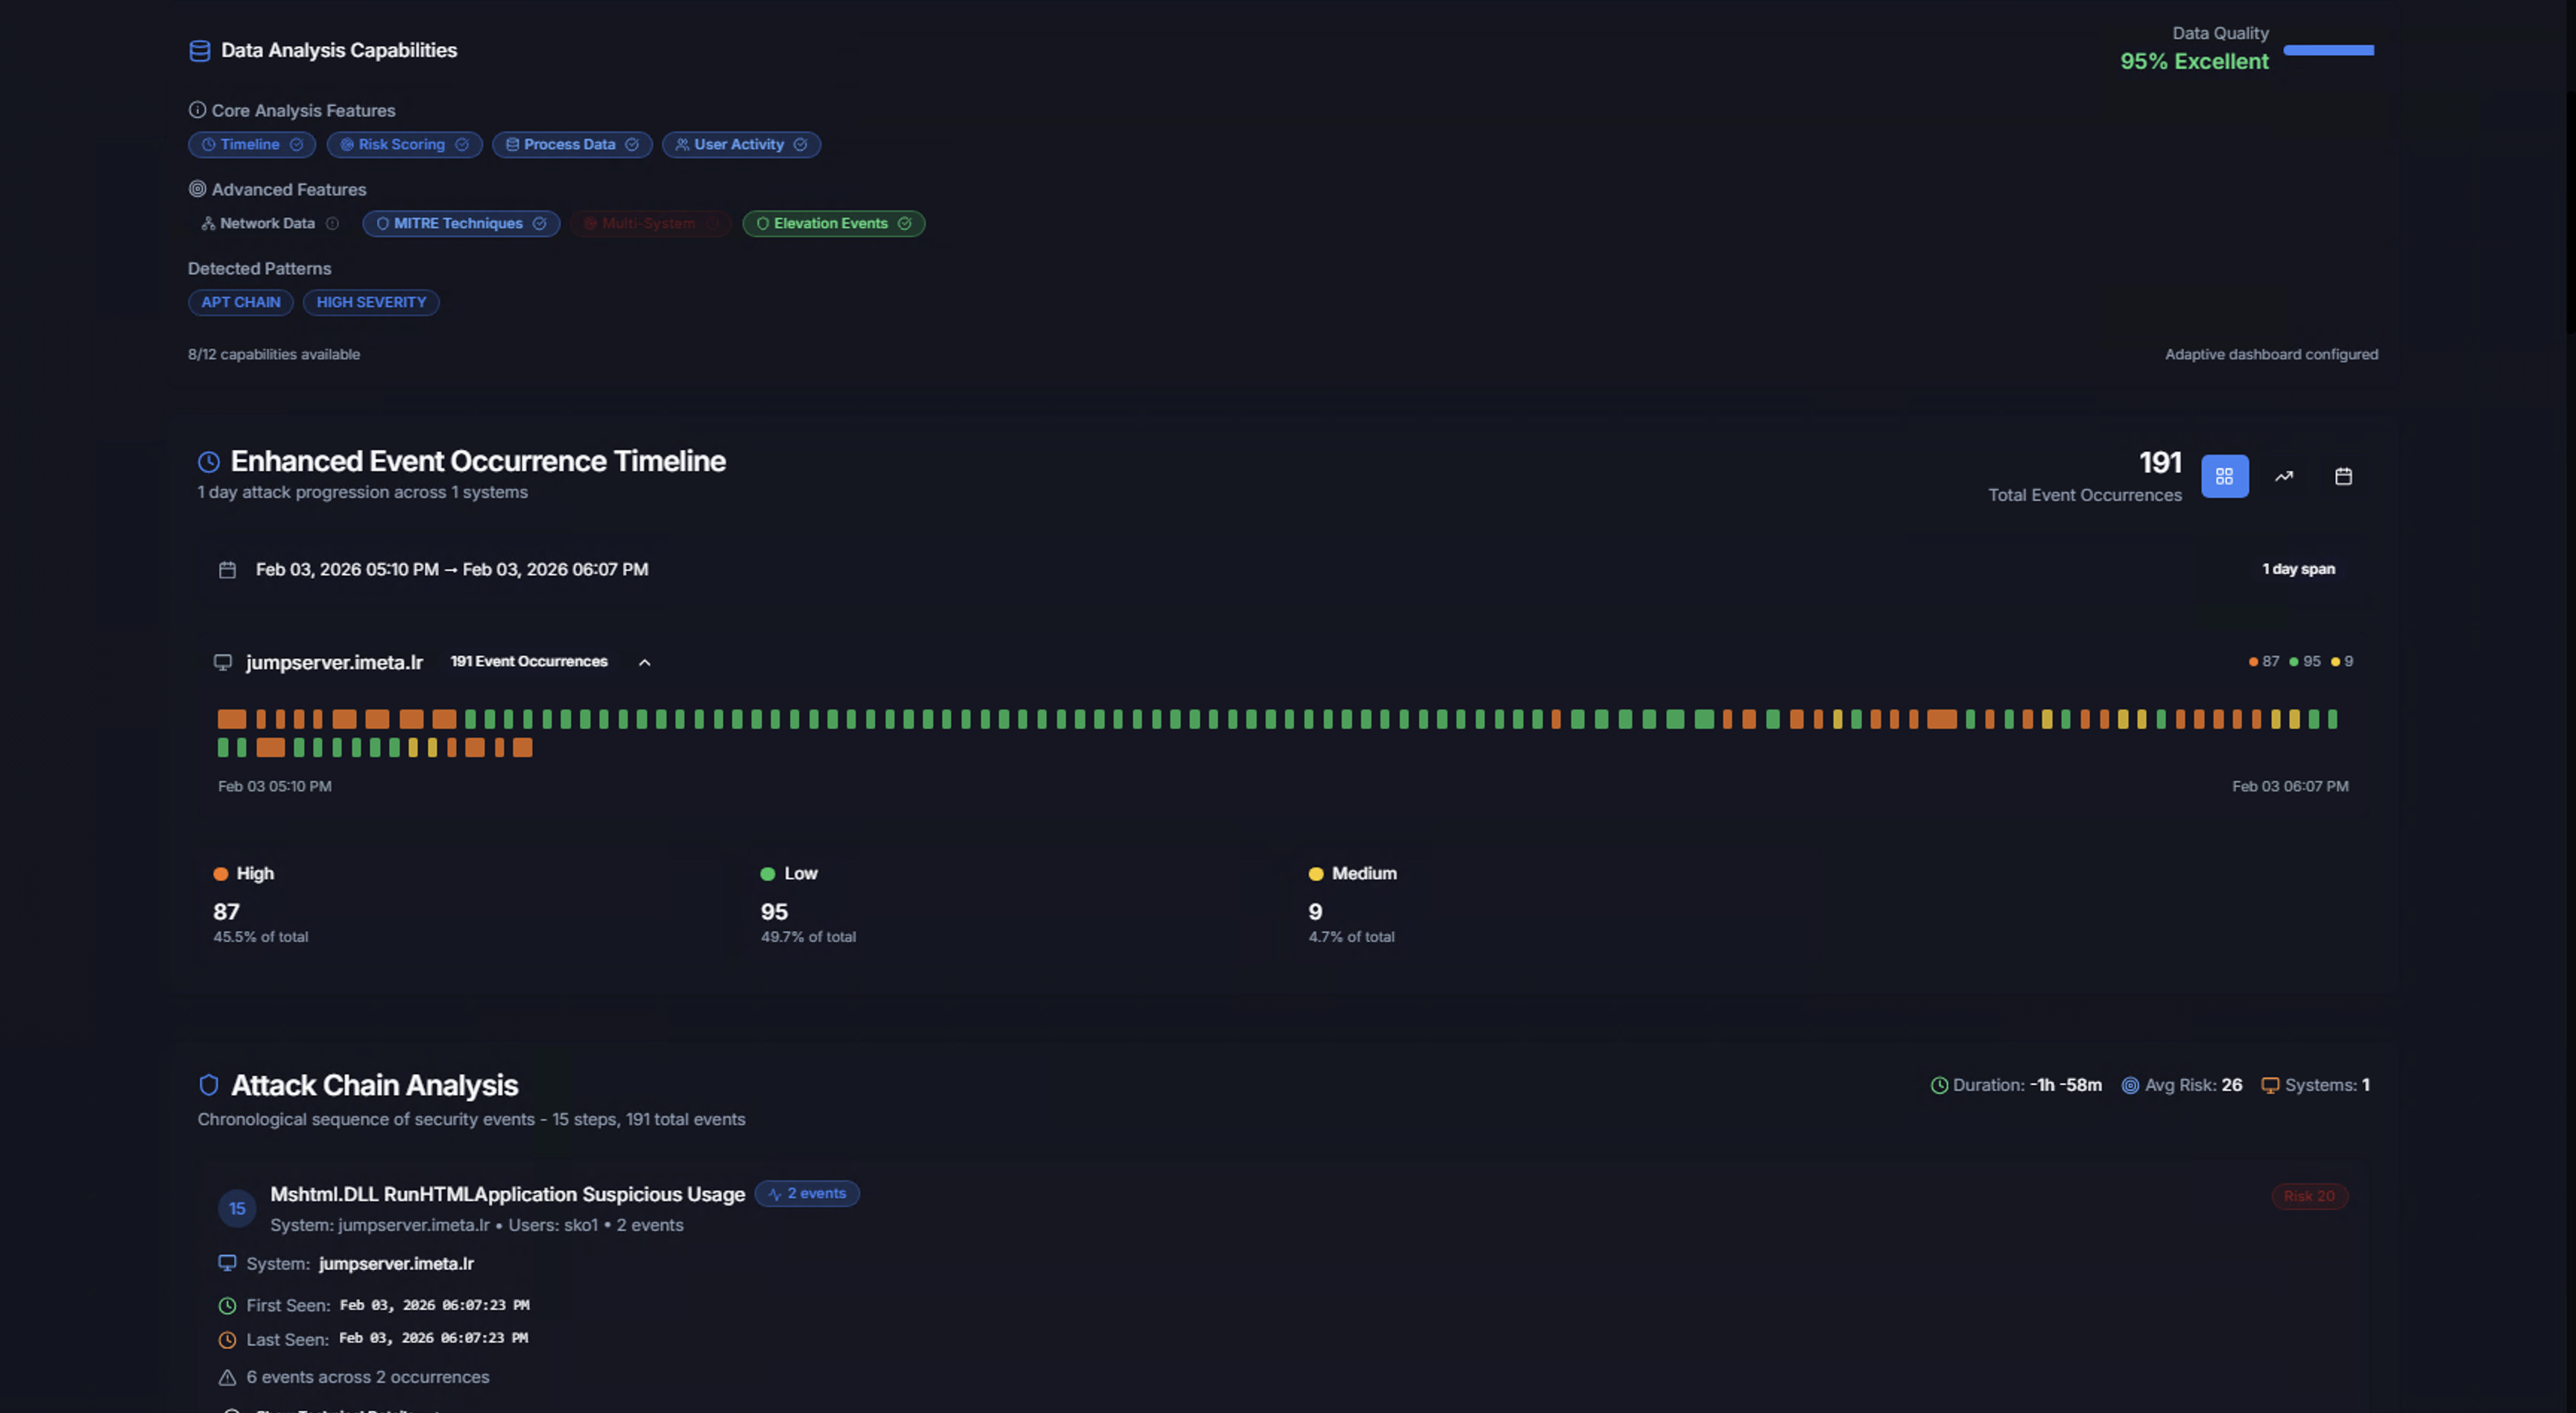
The Data Analysis Capabilities section shows what analytical tools are available for this case:
Core Analysis Features
Feature toggles that can be enabled for the case investigation:
- Timeline — Chronological event view
- Risk Scoring — Risk-based prioritization
- Process Data — Process execution chain analysis
- User Activity — User behavior analysis
Advanced Features
- Network Data — Network connection analysis
- MITRE Techniques — ATT&CK technique mapping
- Elevation Events — Privilege escalation tracking
Detected Patterns
Tags showing the correlation patterns identified — e.g., APT CHAIN, HIGH SEVERITY. The Data Quality indicator shows how complete the data is (e.g., 95% Excellent).
Enhanced Event Occurrence Timeline

The timeline displays a scatter chart of all events in the case, plotted by time (x-axis) and volume (y-axis). Each dot represents an event occurrence, color-coded by severity:
- Orange — High severity
- Green — Low severity
- Yellow — Medium severity
Hover over any dot to see the event details including timestamp, system name, rule name, risk level, count, and process information.
Below the chart, a severity breakdown shows the distribution:
| Severity | Count | Percentage |
|---|---|---|
| High | Count | % of total |
| Low | Count | % of total |
| Medium | Count | % of total |
Attack Chain Analysis
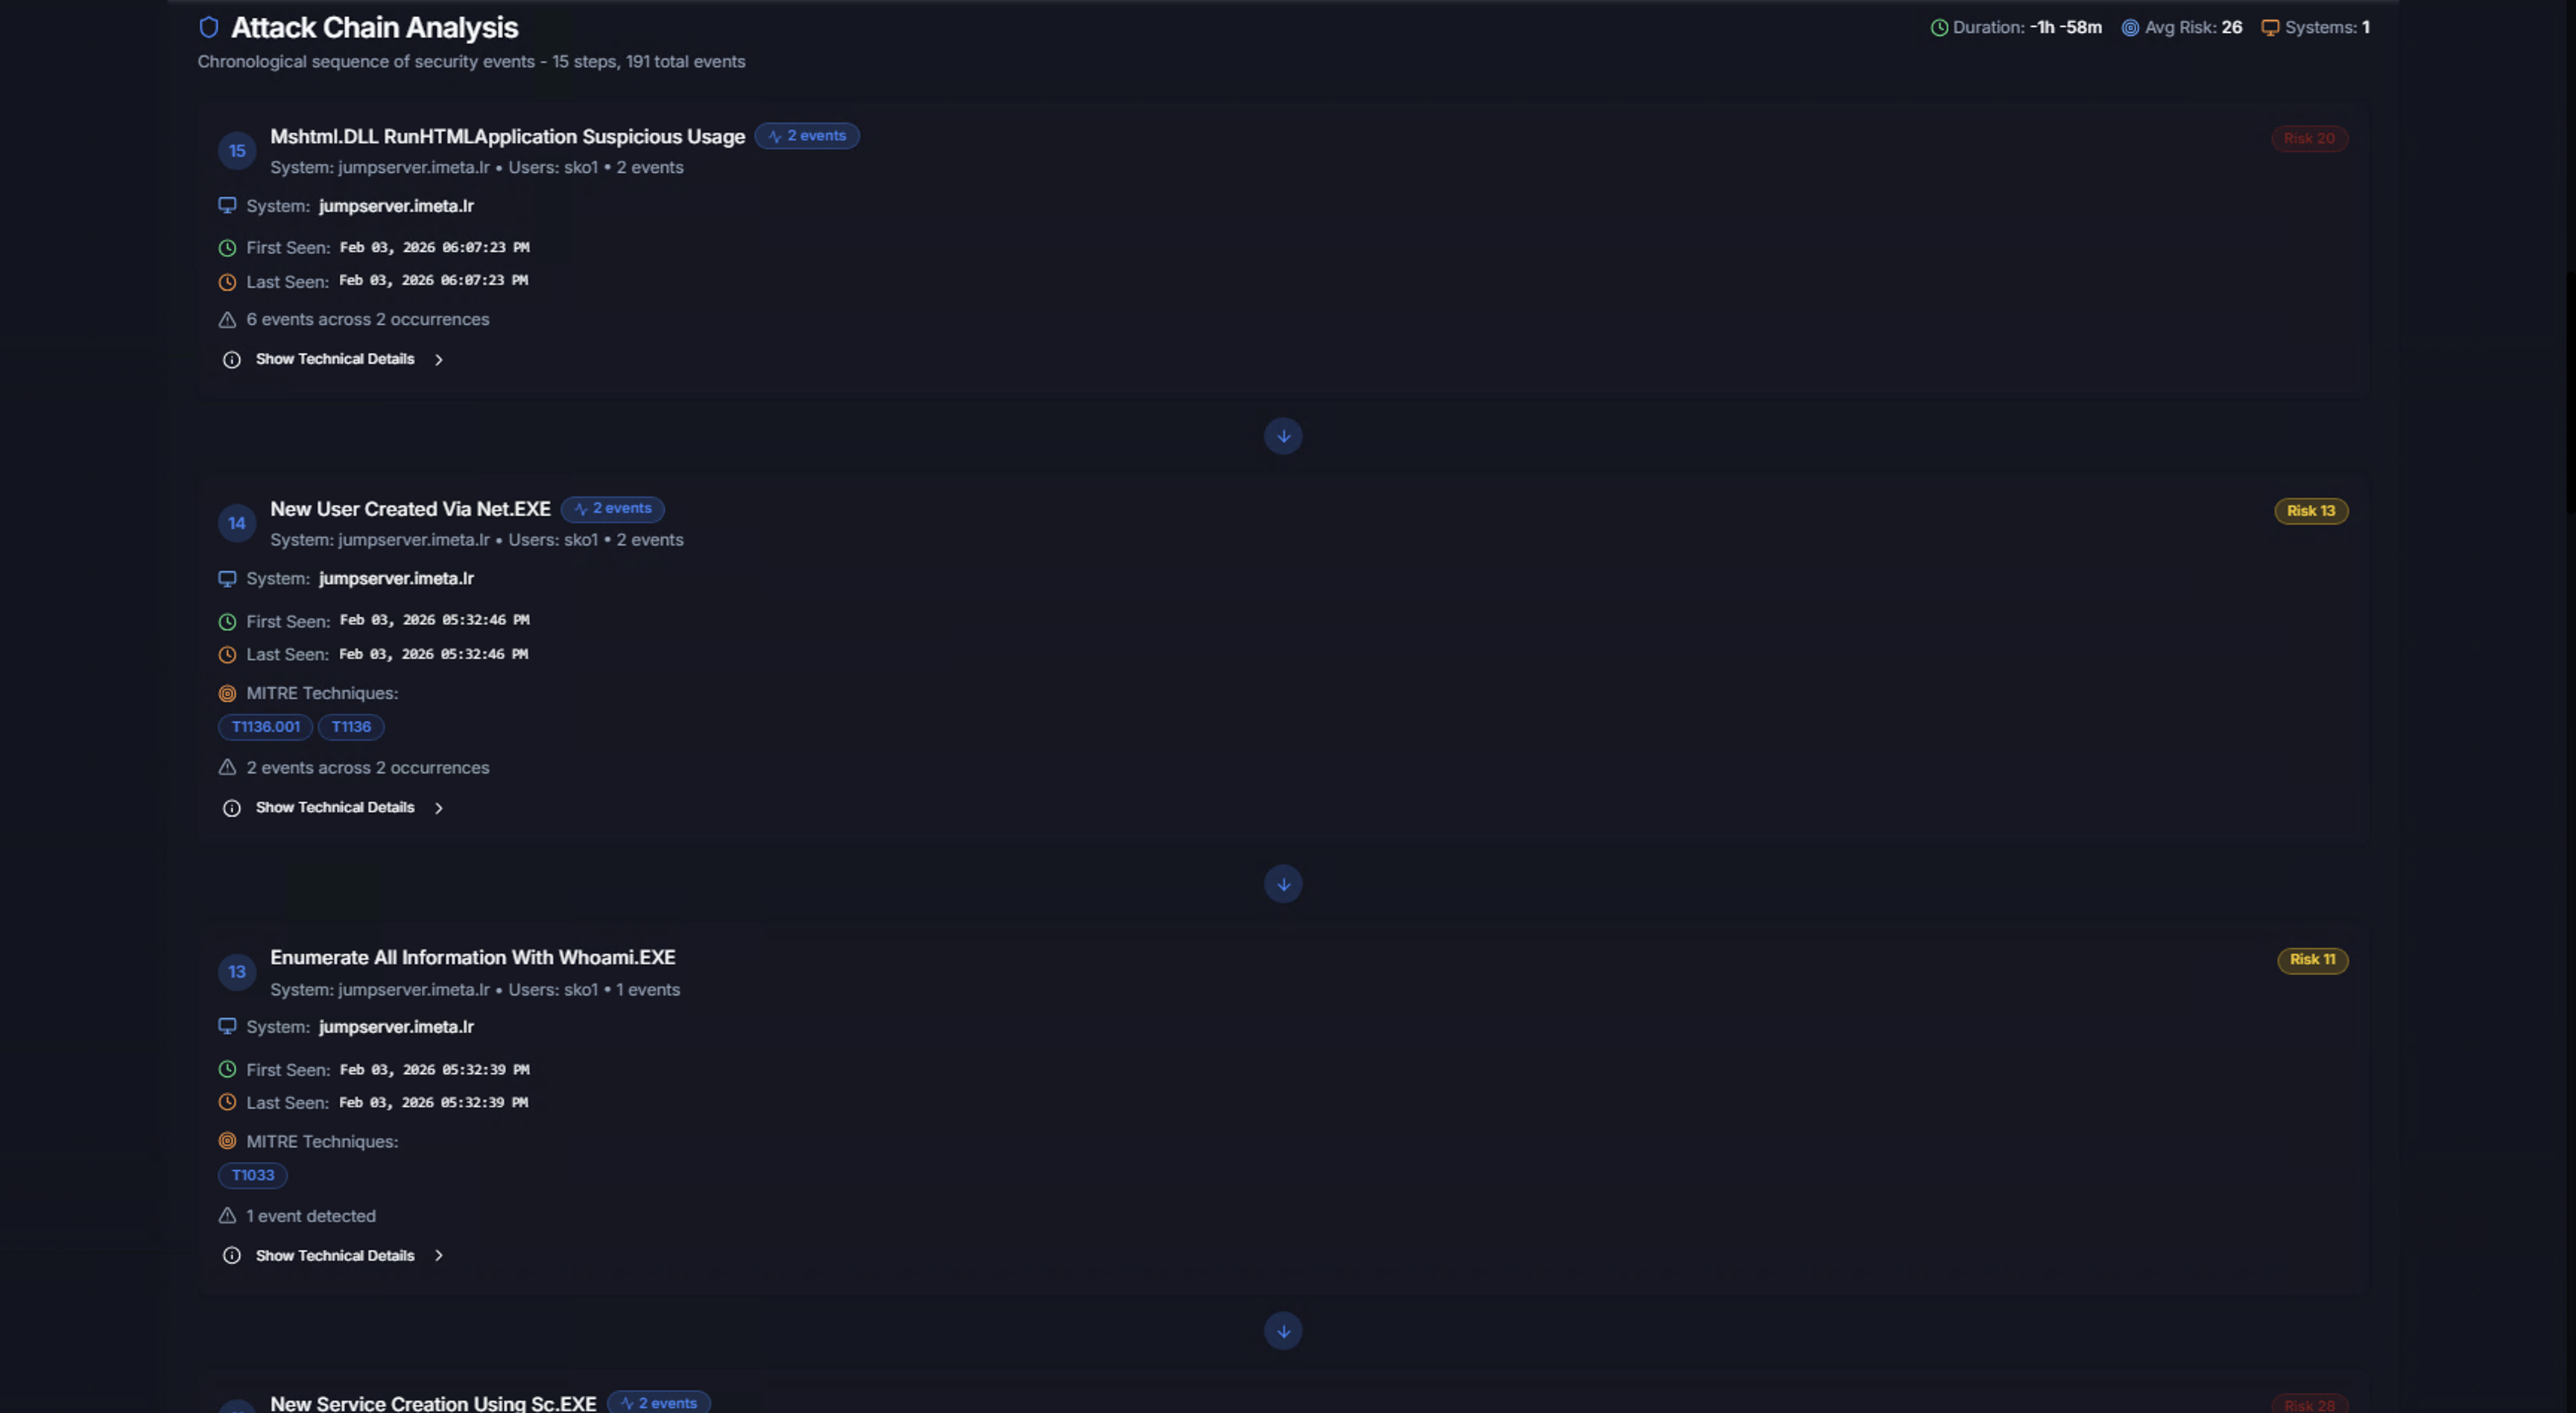
The Attack Chain Analysis section is the core of the case investigation. It reconstructs the chronological sequence of the attack by linking correlated alerts into a step-by-step chain.
Each step in the chain shows:
| Element | Description |
|---|---|
| Step number | Position in the attack sequence |
| Alert title | The Sigma rule that triggered |
| System and users | Which system and accounts were involved |
| Event count badge | How many individual events make up this step |
| Risk score | Risk level for this specific step |
| System | The affected system |
| First Seen / Last Seen | When this step started and last occurred |
| MITRE Techniques | ATT&CK technique IDs for this step |
| Occurrences | Total event count |
| Show Technical Details | Expand to see full technical data |
The attack chain metadata at the top shows:
- Duration — Total time span of the attack chain
- Avg Risk — Average risk score across all steps
- Systems — Number of systems involved
Drilling Into an Attack Step
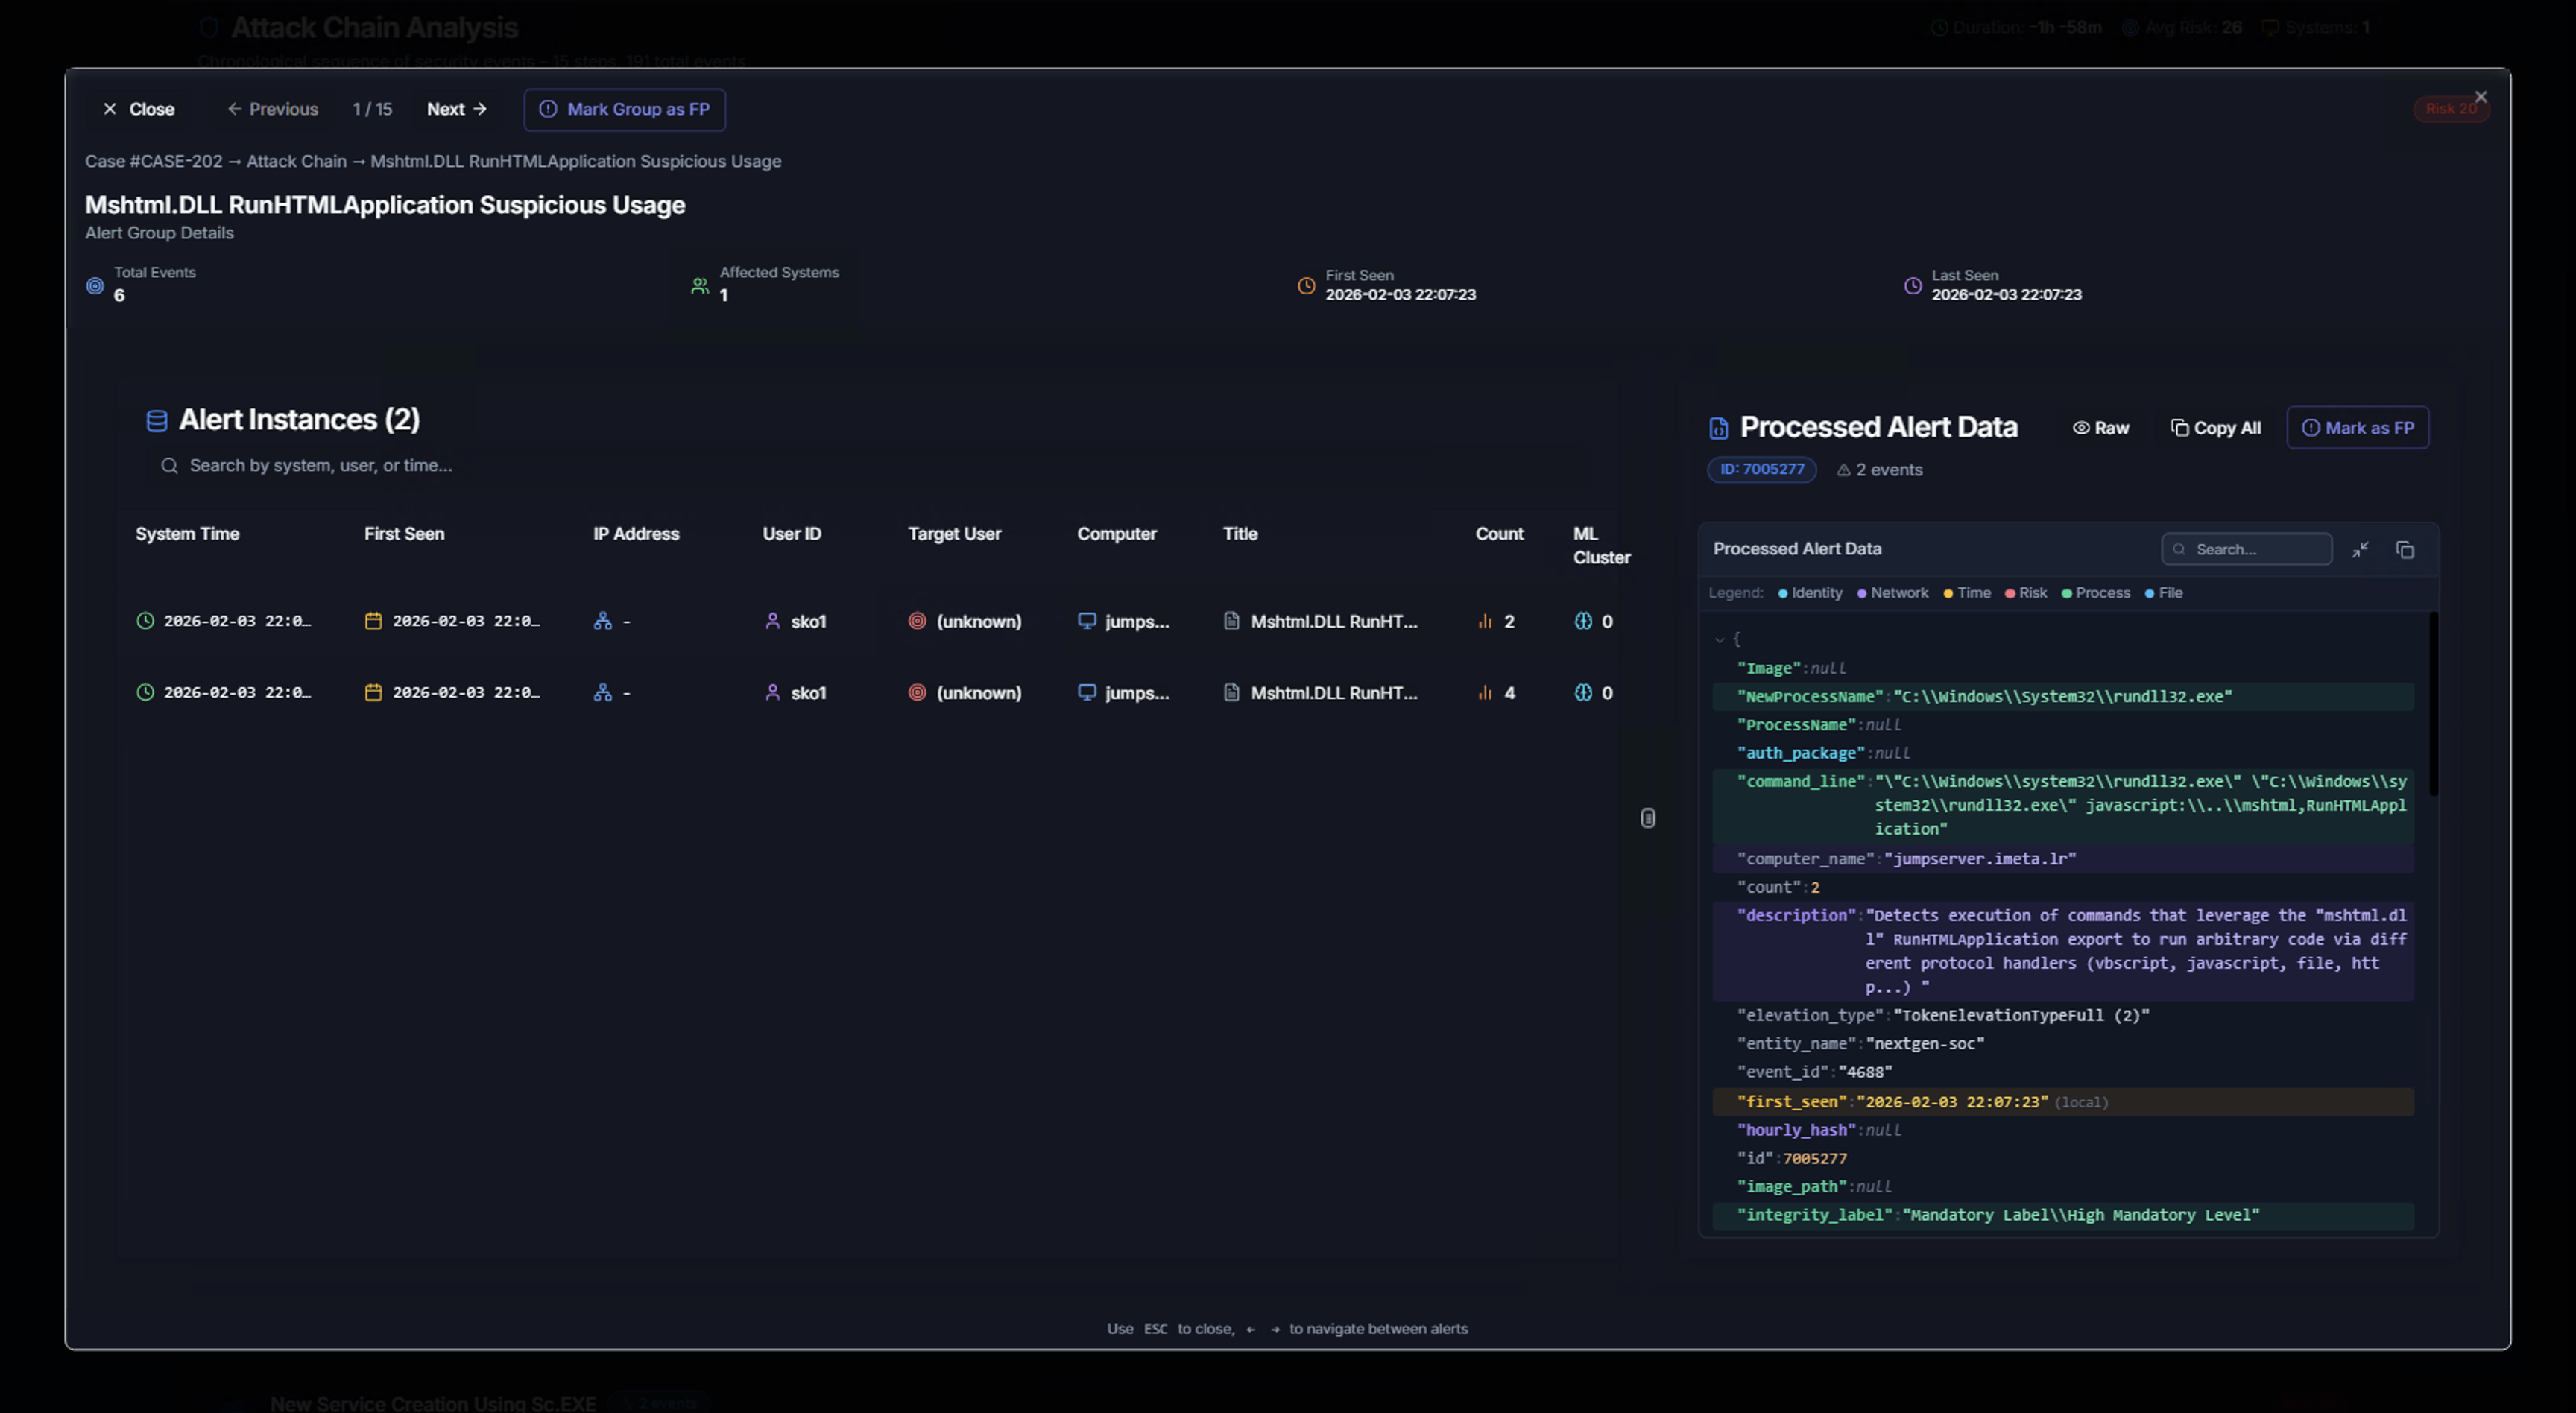
Click on any step in the attack chain to open the Alert Group Detail view:
Left panel — Alert Instances:
| Column | Description |
|---|---|
| System Time | Exact event timestamp |
| First Seen | When this specific instance was first observed |
| IP Address | Source IP |
| User ID | Account that performed the action |
| Target User | Account being targeted |
| Computer | System where the event occurred |
| Title | Sigma rule name |
| Count | Number of occurrences |
| ML Cluster | ML anomaly classification |
Right panel — Processed Alert Data:
The raw processed alert data in JSON format showing every field: Image path, process name, command line, computer name, description, elevation type, entity name, first seen, hourly hash, image path, integrity label, and more.
Use the tabs at the top to switch between Identity, Network, Process, Time, Processes, and File views of the data.
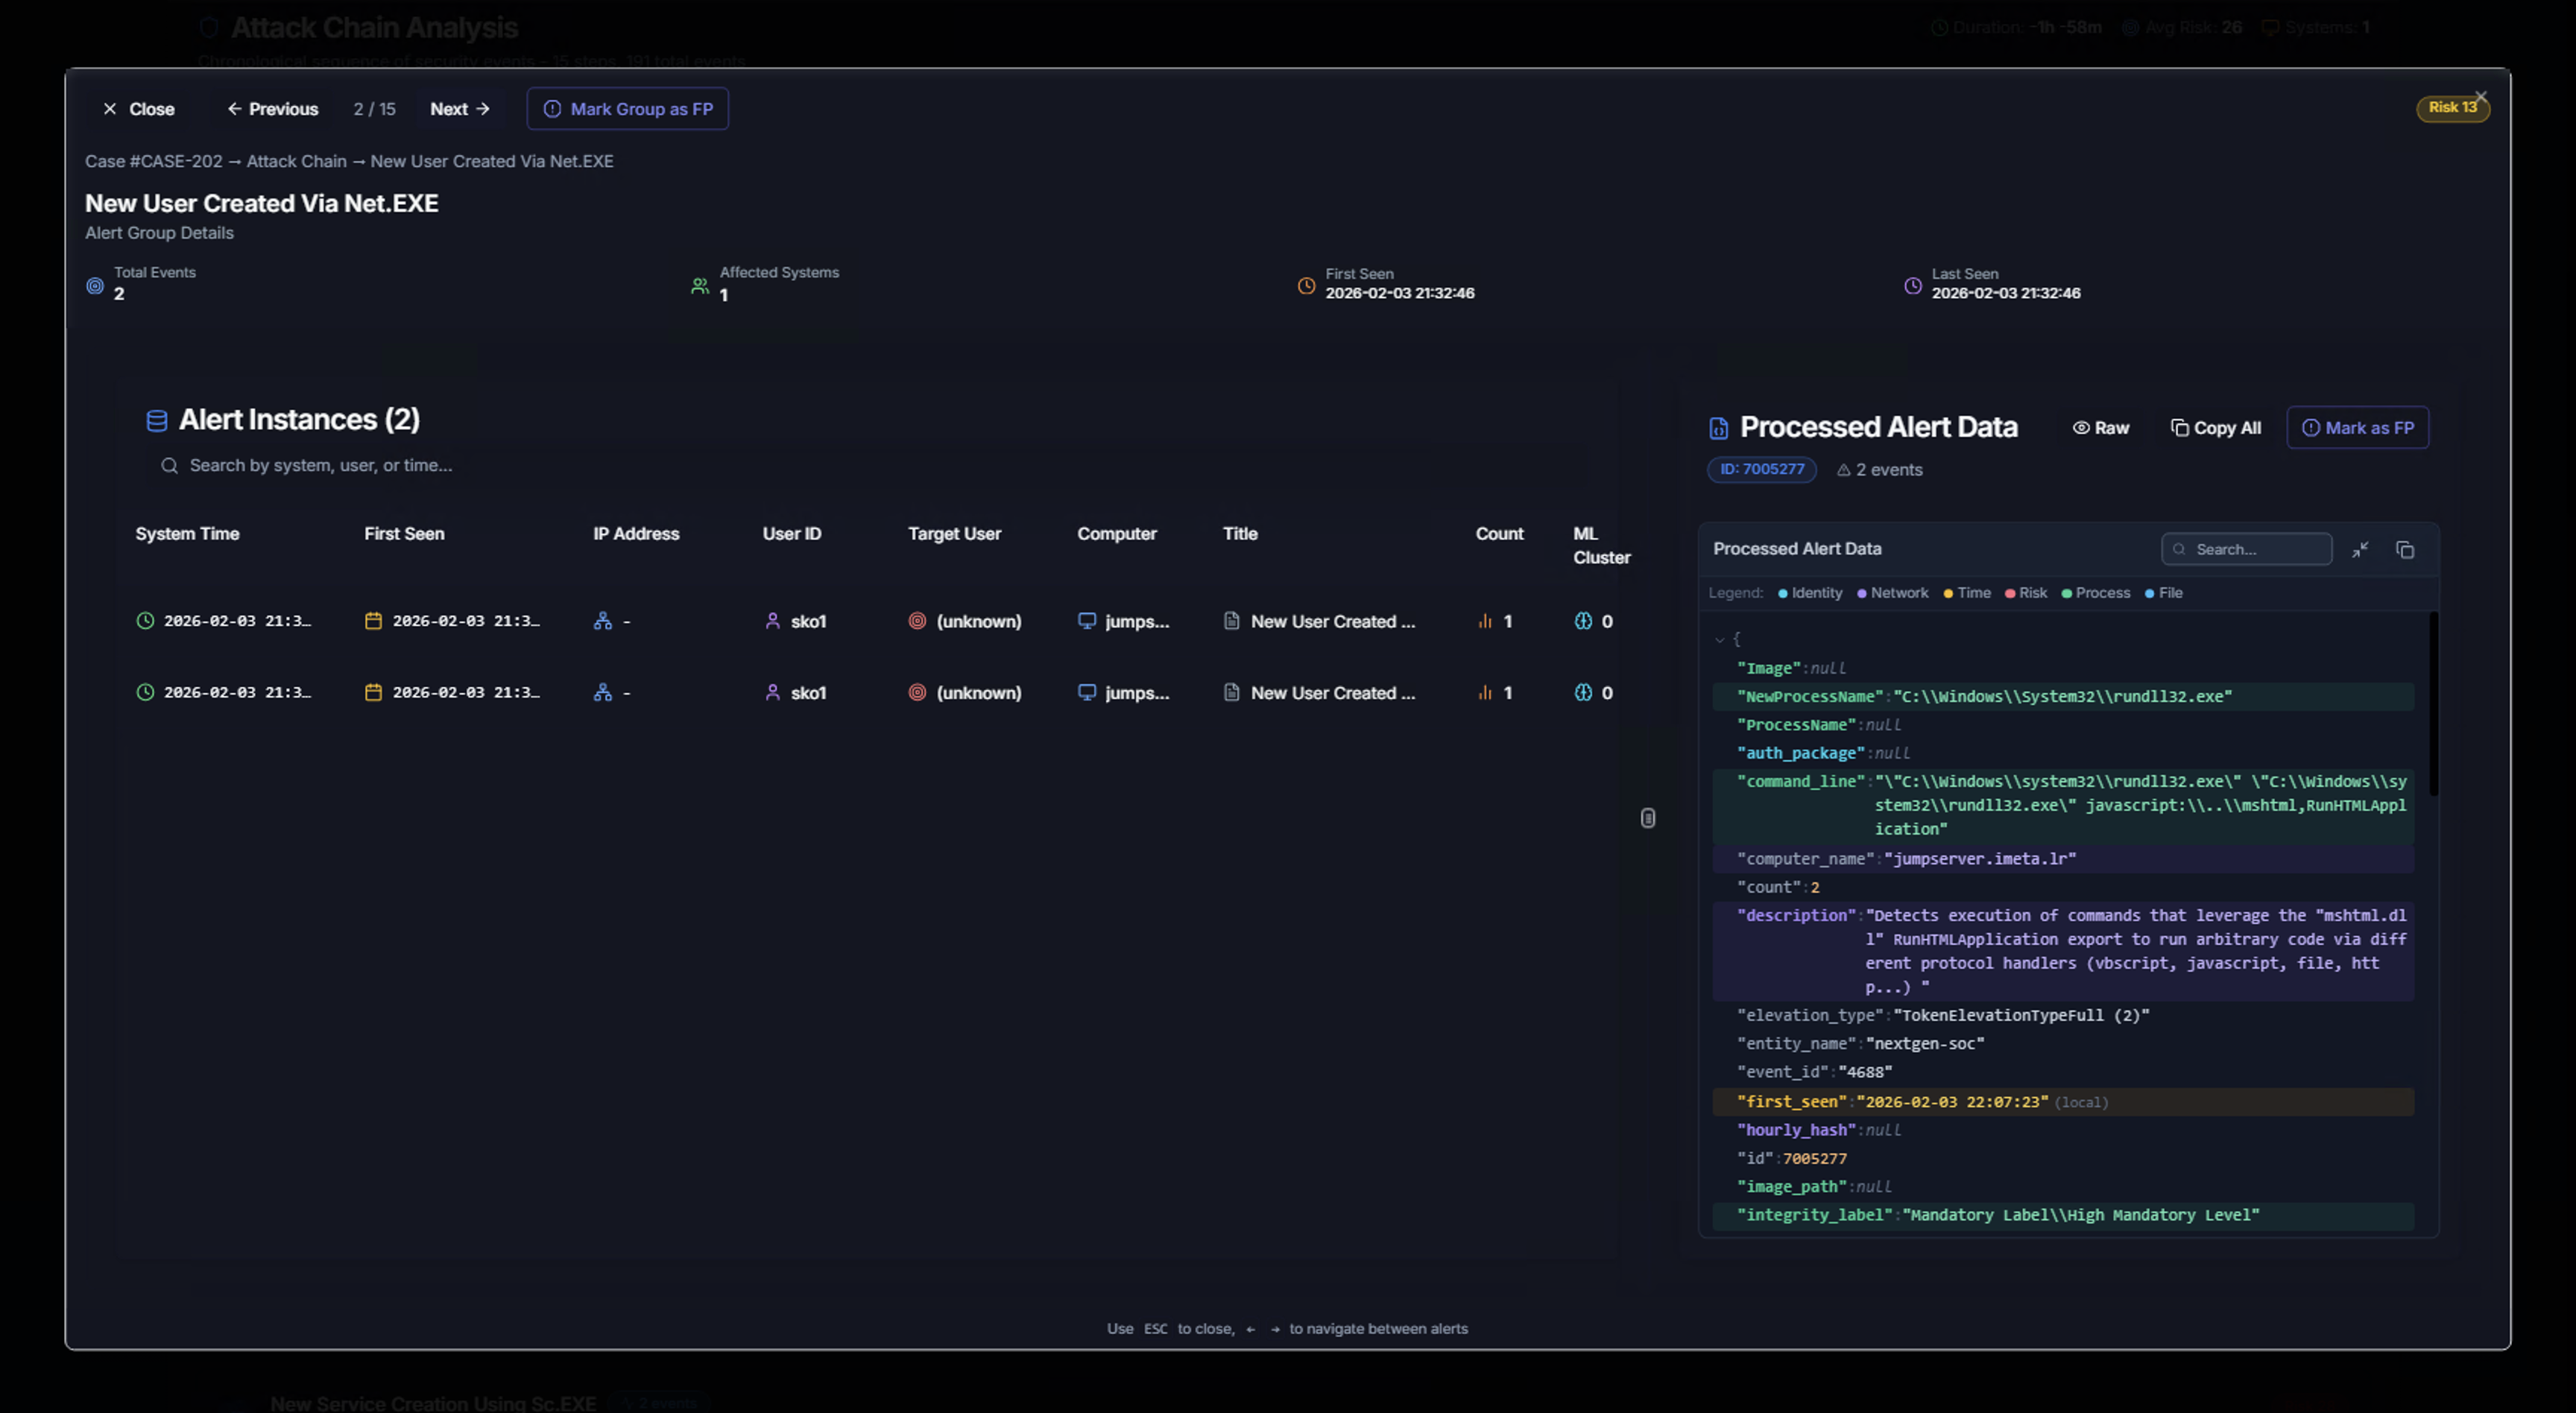
Use the Previous and Next buttons to navigate between attack chain steps. The breadcrumb trail at the top shows your position (e.g., Case → Attack Chain → Alert Group Name).
Marking an Alert Group as False Positive
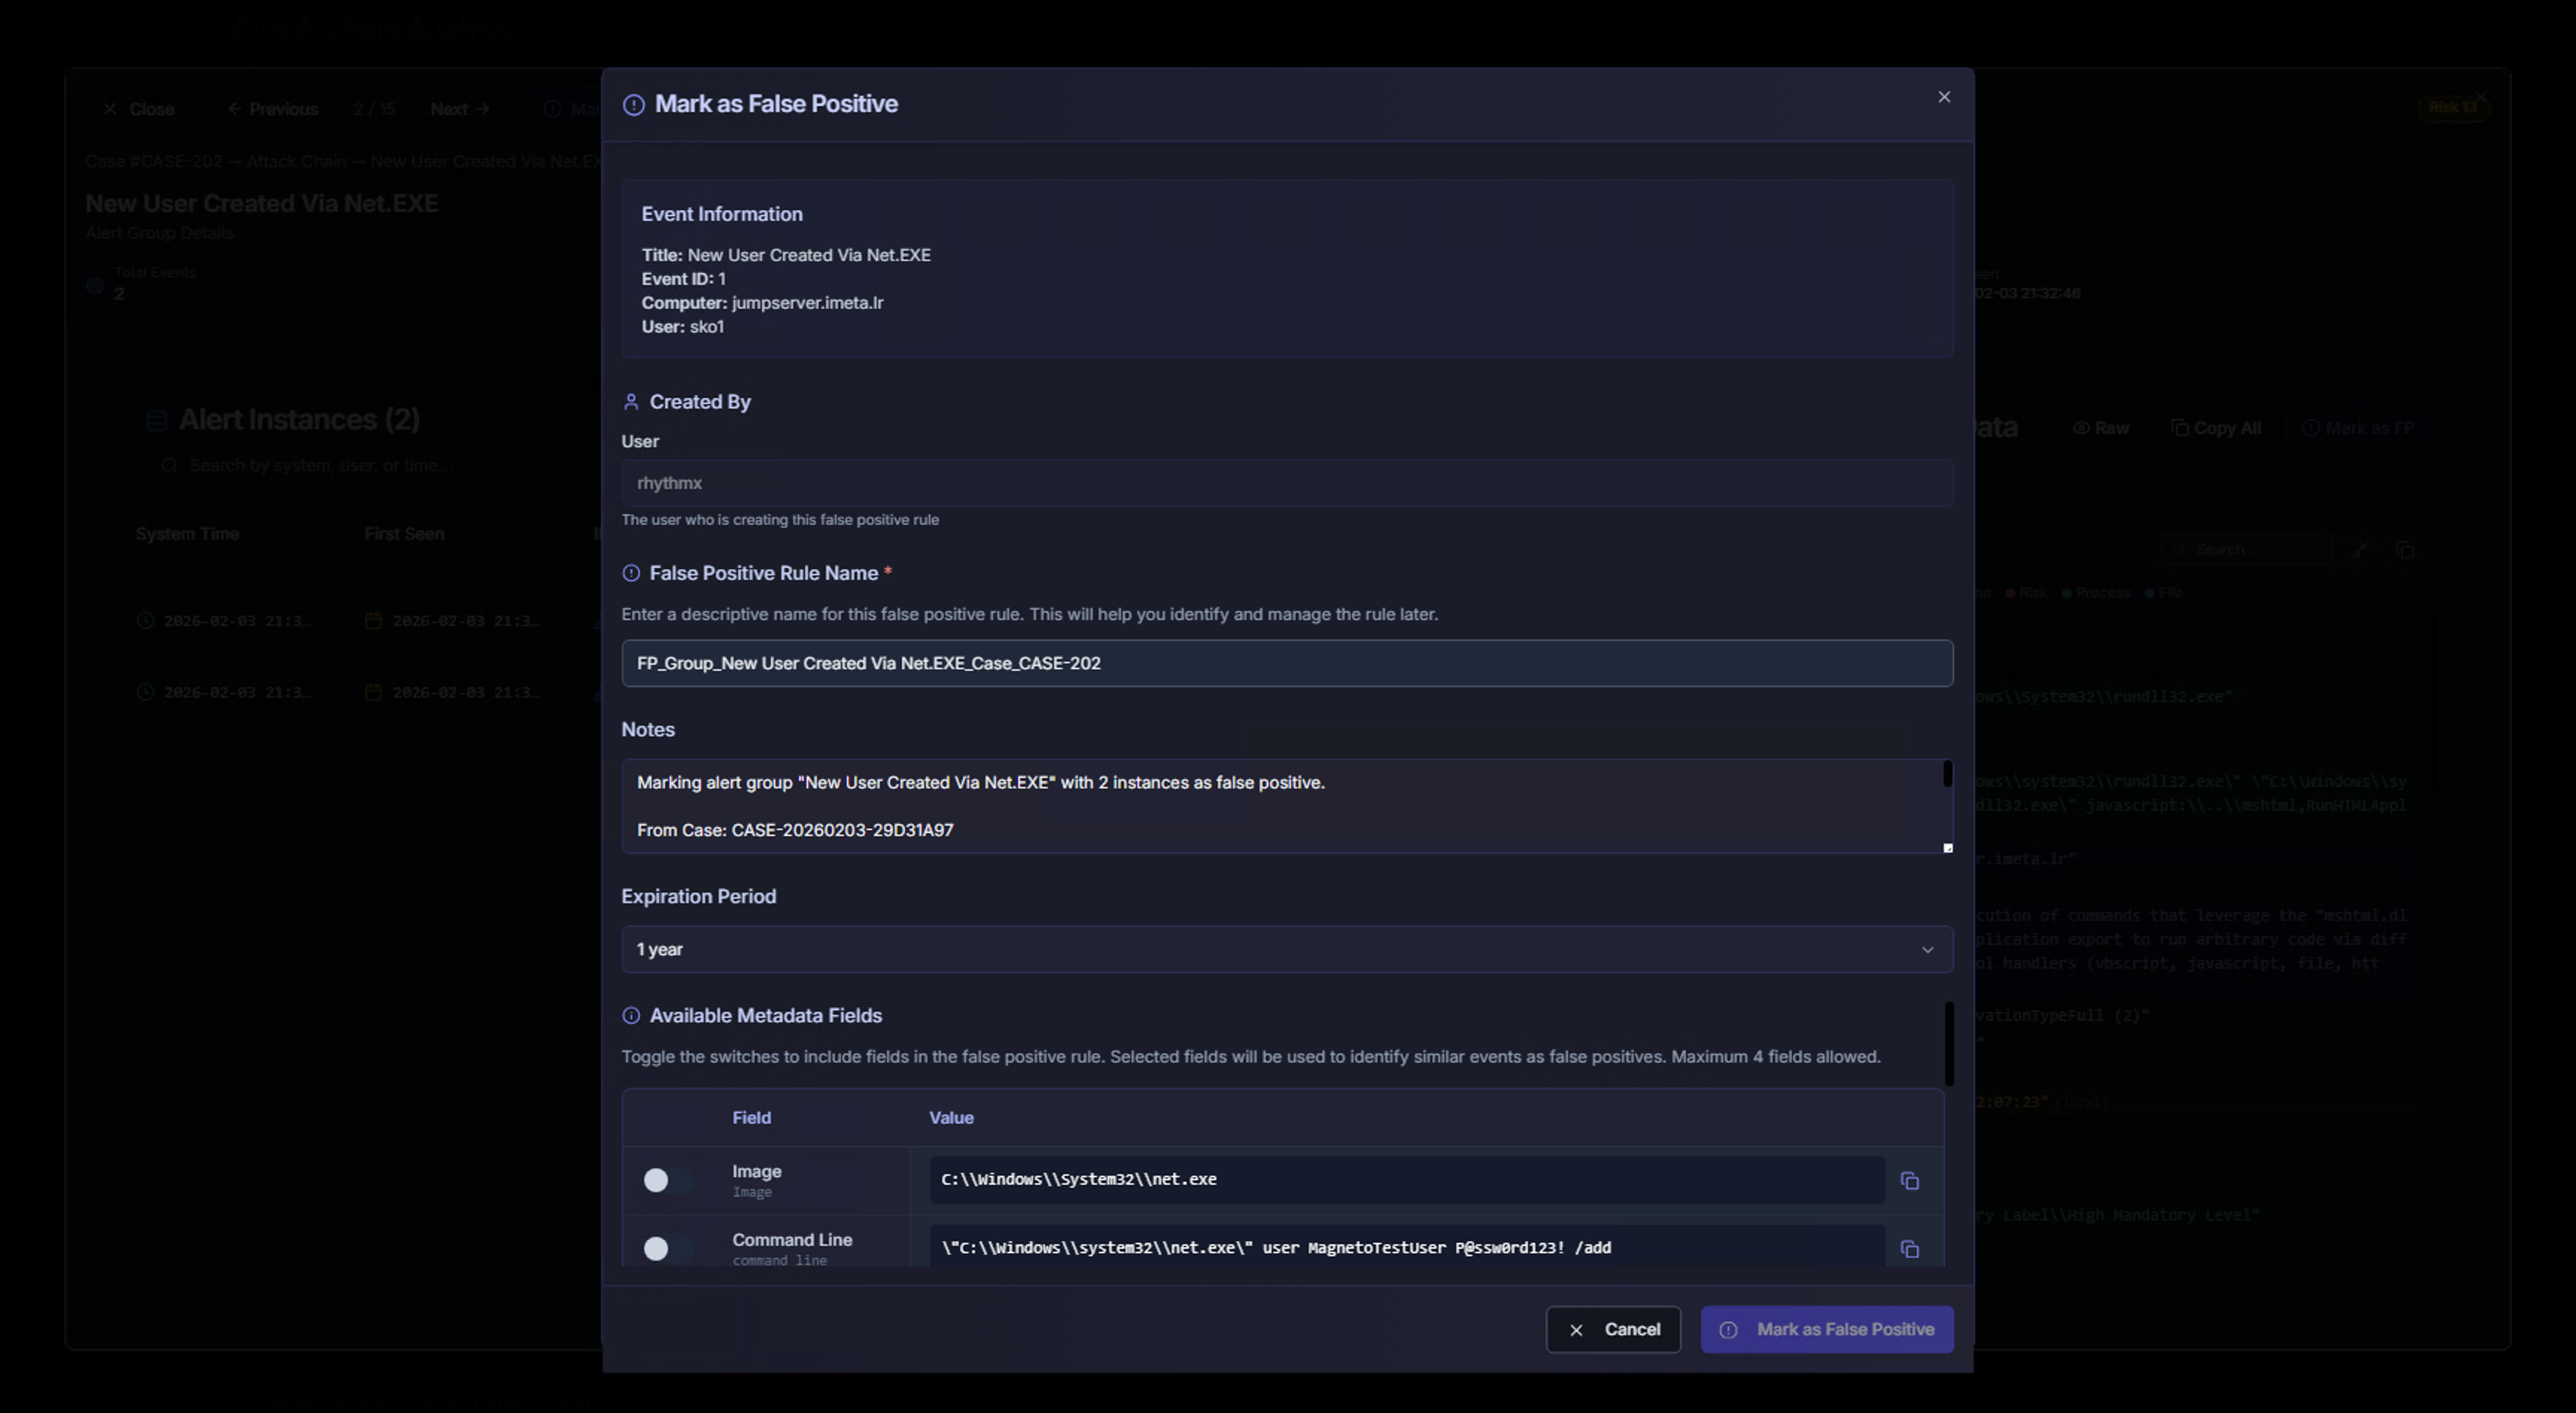
From within the attack chain drill-down, click Mark Group as FP to mark an entire alert group as a false positive. This opens the standard false positive dialog pre-populated with the alert group details, including:
- Event Information (title, Event ID, computer, user)
- False Positive Rule Name (auto-generated with case reference)
- Notes (auto-populated with case context: "From Case: CASE-20260203-29D31A97")
- Available Metadata Fields (Image, Command Line, etc.)
AI-Powered Case Triage
Click Case Triage to launch the RhythmX Analyst for a comprehensive AI analysis of the entire case.
AI Analysis — Summary & Recommendations
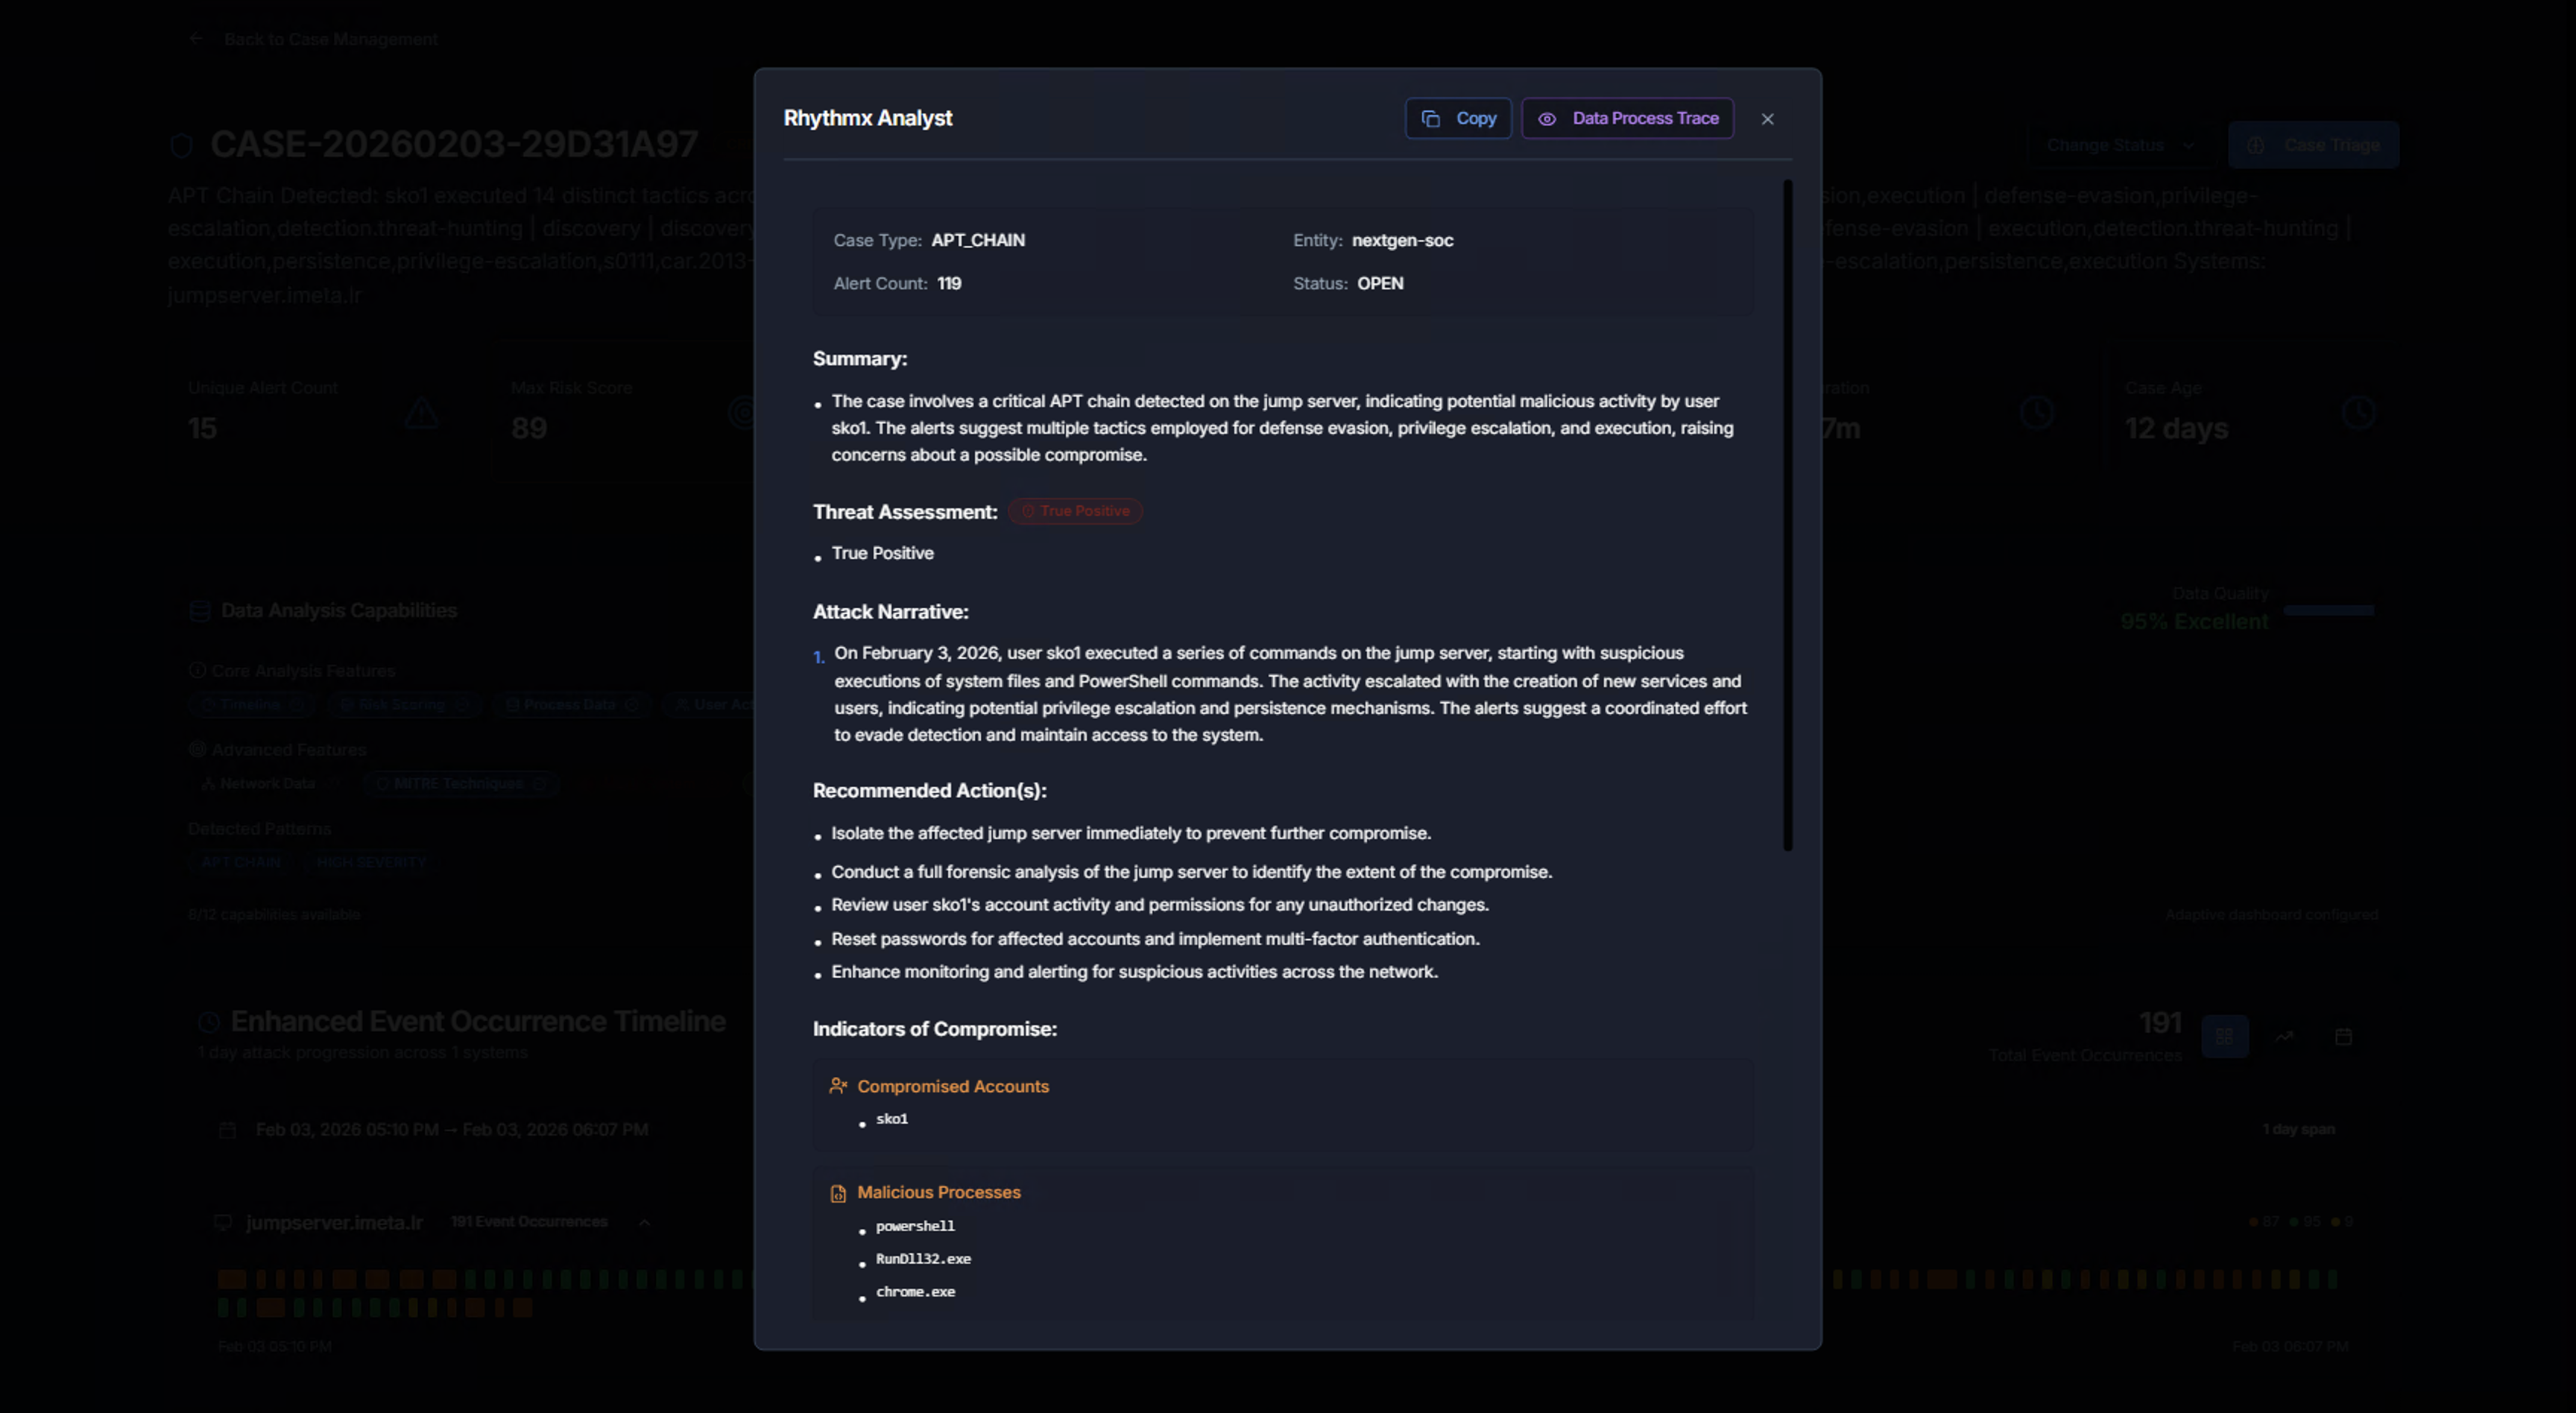
The AI analyst provides a structured case report:
| Section | What It Contains |
|---|---|
| Case Type | The correlation type (e.g., APT_CHAIN) |
| Entity & Alert Count | Which entity and how many alerts are in the case |
| Status | Current case status |
| Summary | High-level overview of what was detected and why it matters |
| Threat Assessment | Severity classification with color-coded badge (e.g., CRITICAL) and whether it's a true positive |
| Attack Narrative | A detailed chronological description of the attack — what the adversary did, step by step, in plain language |
| Recommended Action(s) | Specific, prioritized steps the analyst should take (isolate systems, conduct forensics, review accounts, reset passwords, enhance monitoring) |
| Indicators of Compromise | Compromised accounts, malicious processes, and suspicious commands identified in the case |
AI Analysis — Risk & Detection
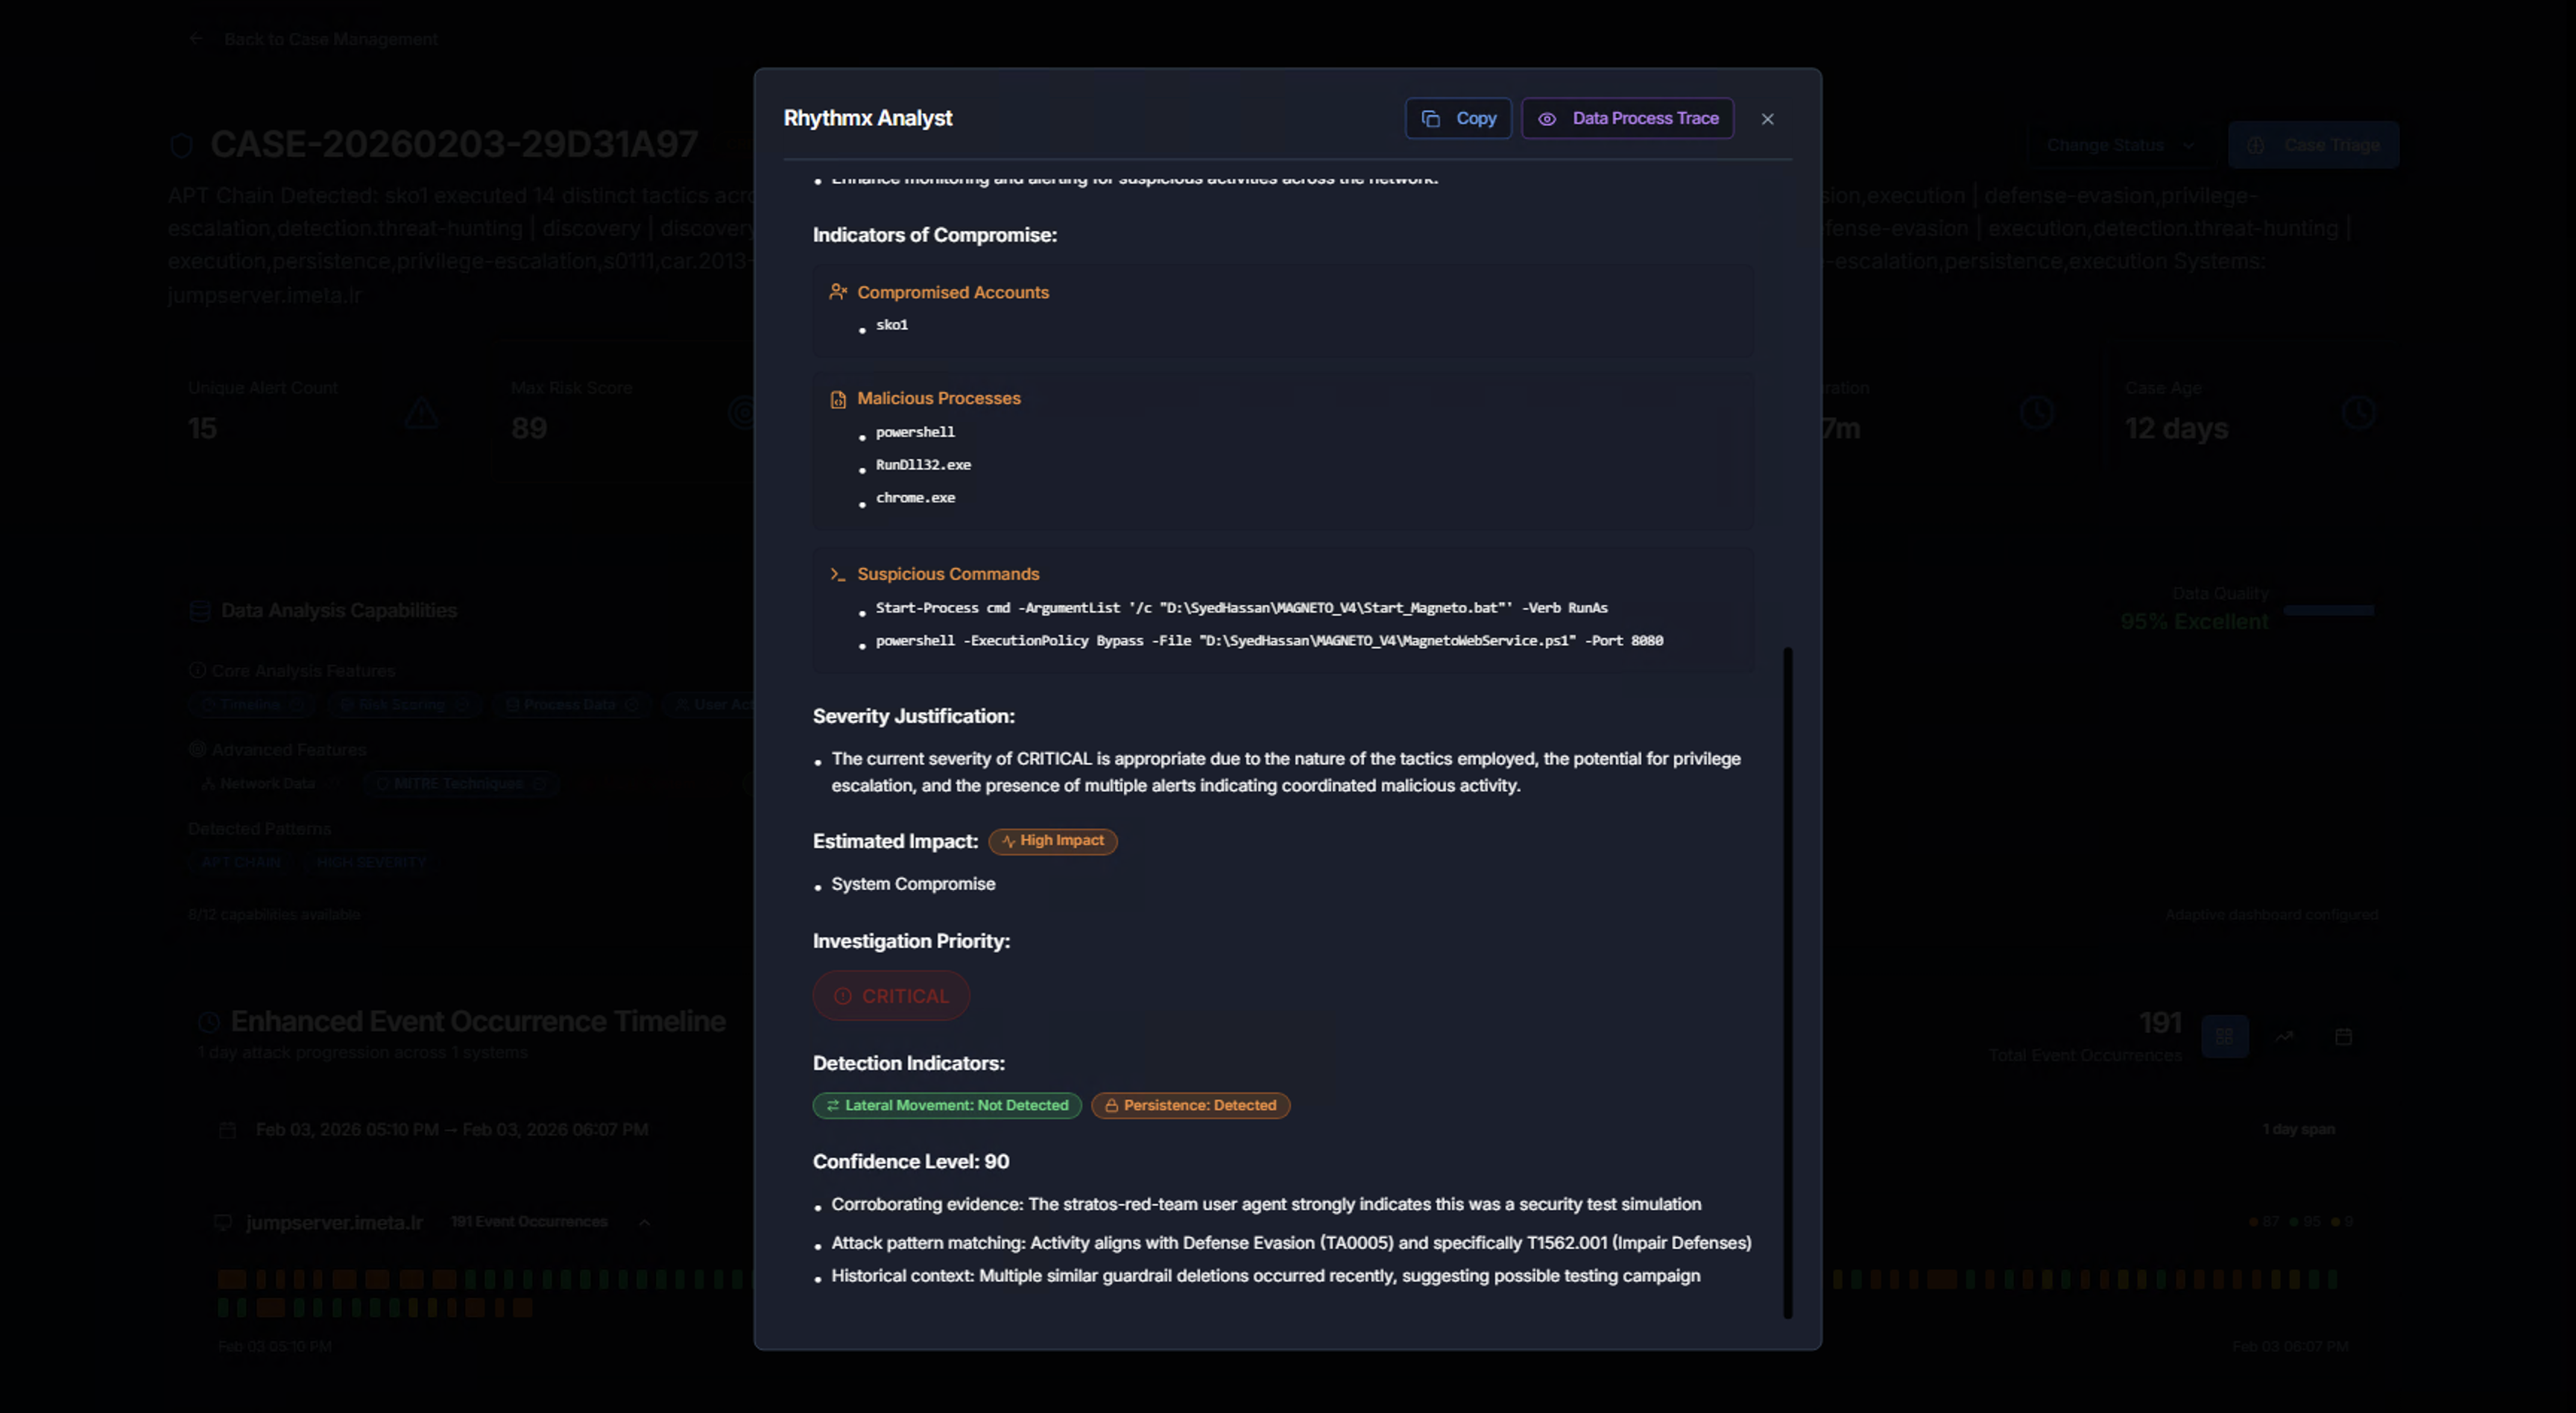
Scrolling down reveals additional analysis:
| Section | What It Contains |
|---|---|
| Indicators of Compromise | Compromised Accounts (e.g., sko1), Malicious Processes (e.g., rundll32.exe, net.exe, csc.exe), Suspicious Commands (full command lines flagged as malicious) |
| Severity Justification | Why the AI assigned the given severity — explains the reasoning based on tactics, privilege escalation potential, and coordinated activity patterns |
| Estimated Impact | The scope of potential damage (e.g., High impact, System Compromise) |
| Investigation Priority | Priority classification for analyst triage |
| Detection Indicators | Key indicators that triggered the detection (e.g., Lateral Movement Not Detected, Persistence Detected) |
| Confidence Level | Numerical confidence score with supporting evidence (corroborating evidence, attack pattern matching, historical context) |
The AI results include Copy and Data Process Trace buttons for exporting the analysis or reviewing the underlying data flow.
Case Workflow Summary
flowchart TD
    A[RhythmX Analytics<br><b>Correlation Engine</b>] --> B[Case Created<br><b>Status: Open</b>]
    B --> C[Case List<br><b>Filter & Prioritize</b>]
    C --> D[Case Detail<br><b>KPIs & Timeline</b>]
    D --> E[Attack Chain Analysis<br><b>Step-by-Step Reconstruction</b>]
    E --> F[Alert Group Drill-Down<br><b>Individual Events & Raw Data</b>]
    D --> G[AI Case Triage<br><b>Automated Analysis</b>]
    D --> H{Decision}
    H --> I[Mark In Progress<br><b>Active Investigation</b>]
    H --> J[Close Case<br><b>Resolved</b>]
    H --> K[Mark False Positive<br><b>Suppress Future Cases</b>]
F --> L[Mark Group as FP<br><b>Suppress Alert Group</b>]| Step | What the Analyst Does | Key Decision |
|---|---|---|
| 1. Case List | Review open cases, filter by severity/type/entity | Which case to investigate first? |
| 2. Case Detail | Review KPIs, MITRE tactics, and timeline | How broad is this attack? |
| 3. Event Timeline | Examine the scatter chart for patterns and clusters | When did the attack peak? |
| 4. Attack Chain | Walk through the step-by-step attack sequence | What did the adversary do at each stage? |
| 5. Alert Drill-Down | Examine raw event data and process chains | Is this legitimate or malicious? |
| 6. AI Triage | Get automated analysis with IOCs and recommendations | What's the impact and priority? |
| 7. Resolution | Close, mark in progress, or mark as false positive | How should this case be resolved? |