RhythmX Analytics
RhythmX Analytics is the automated threat correlation engine. It continuously monitors detection activity and correlates individual Sigma alerts into higher-order threat scenarios — identifying complex attack patterns like lateral movement chains, APT campaigns, and ransomware indicators that no single Sigma rule can detect on its own.
The engine runs on a configurable schedule, and its status, use cases, and thresholds are all managed from this page.
Accessing RhythmX Analytics
From the Security Control Center, click View Analytics on the RhythmX Analytics widget. The page opens with a status bar showing:
| Indicator | Description |
|---|---|
| Service | Whether the analytics engine is running (green = Running) |
| Last Run | When the engine last executed its correlation cycle |
| Next Run | When the next scheduled correlation cycle will execute |
| Active | Number of currently active correlation use cases |
Management Tab
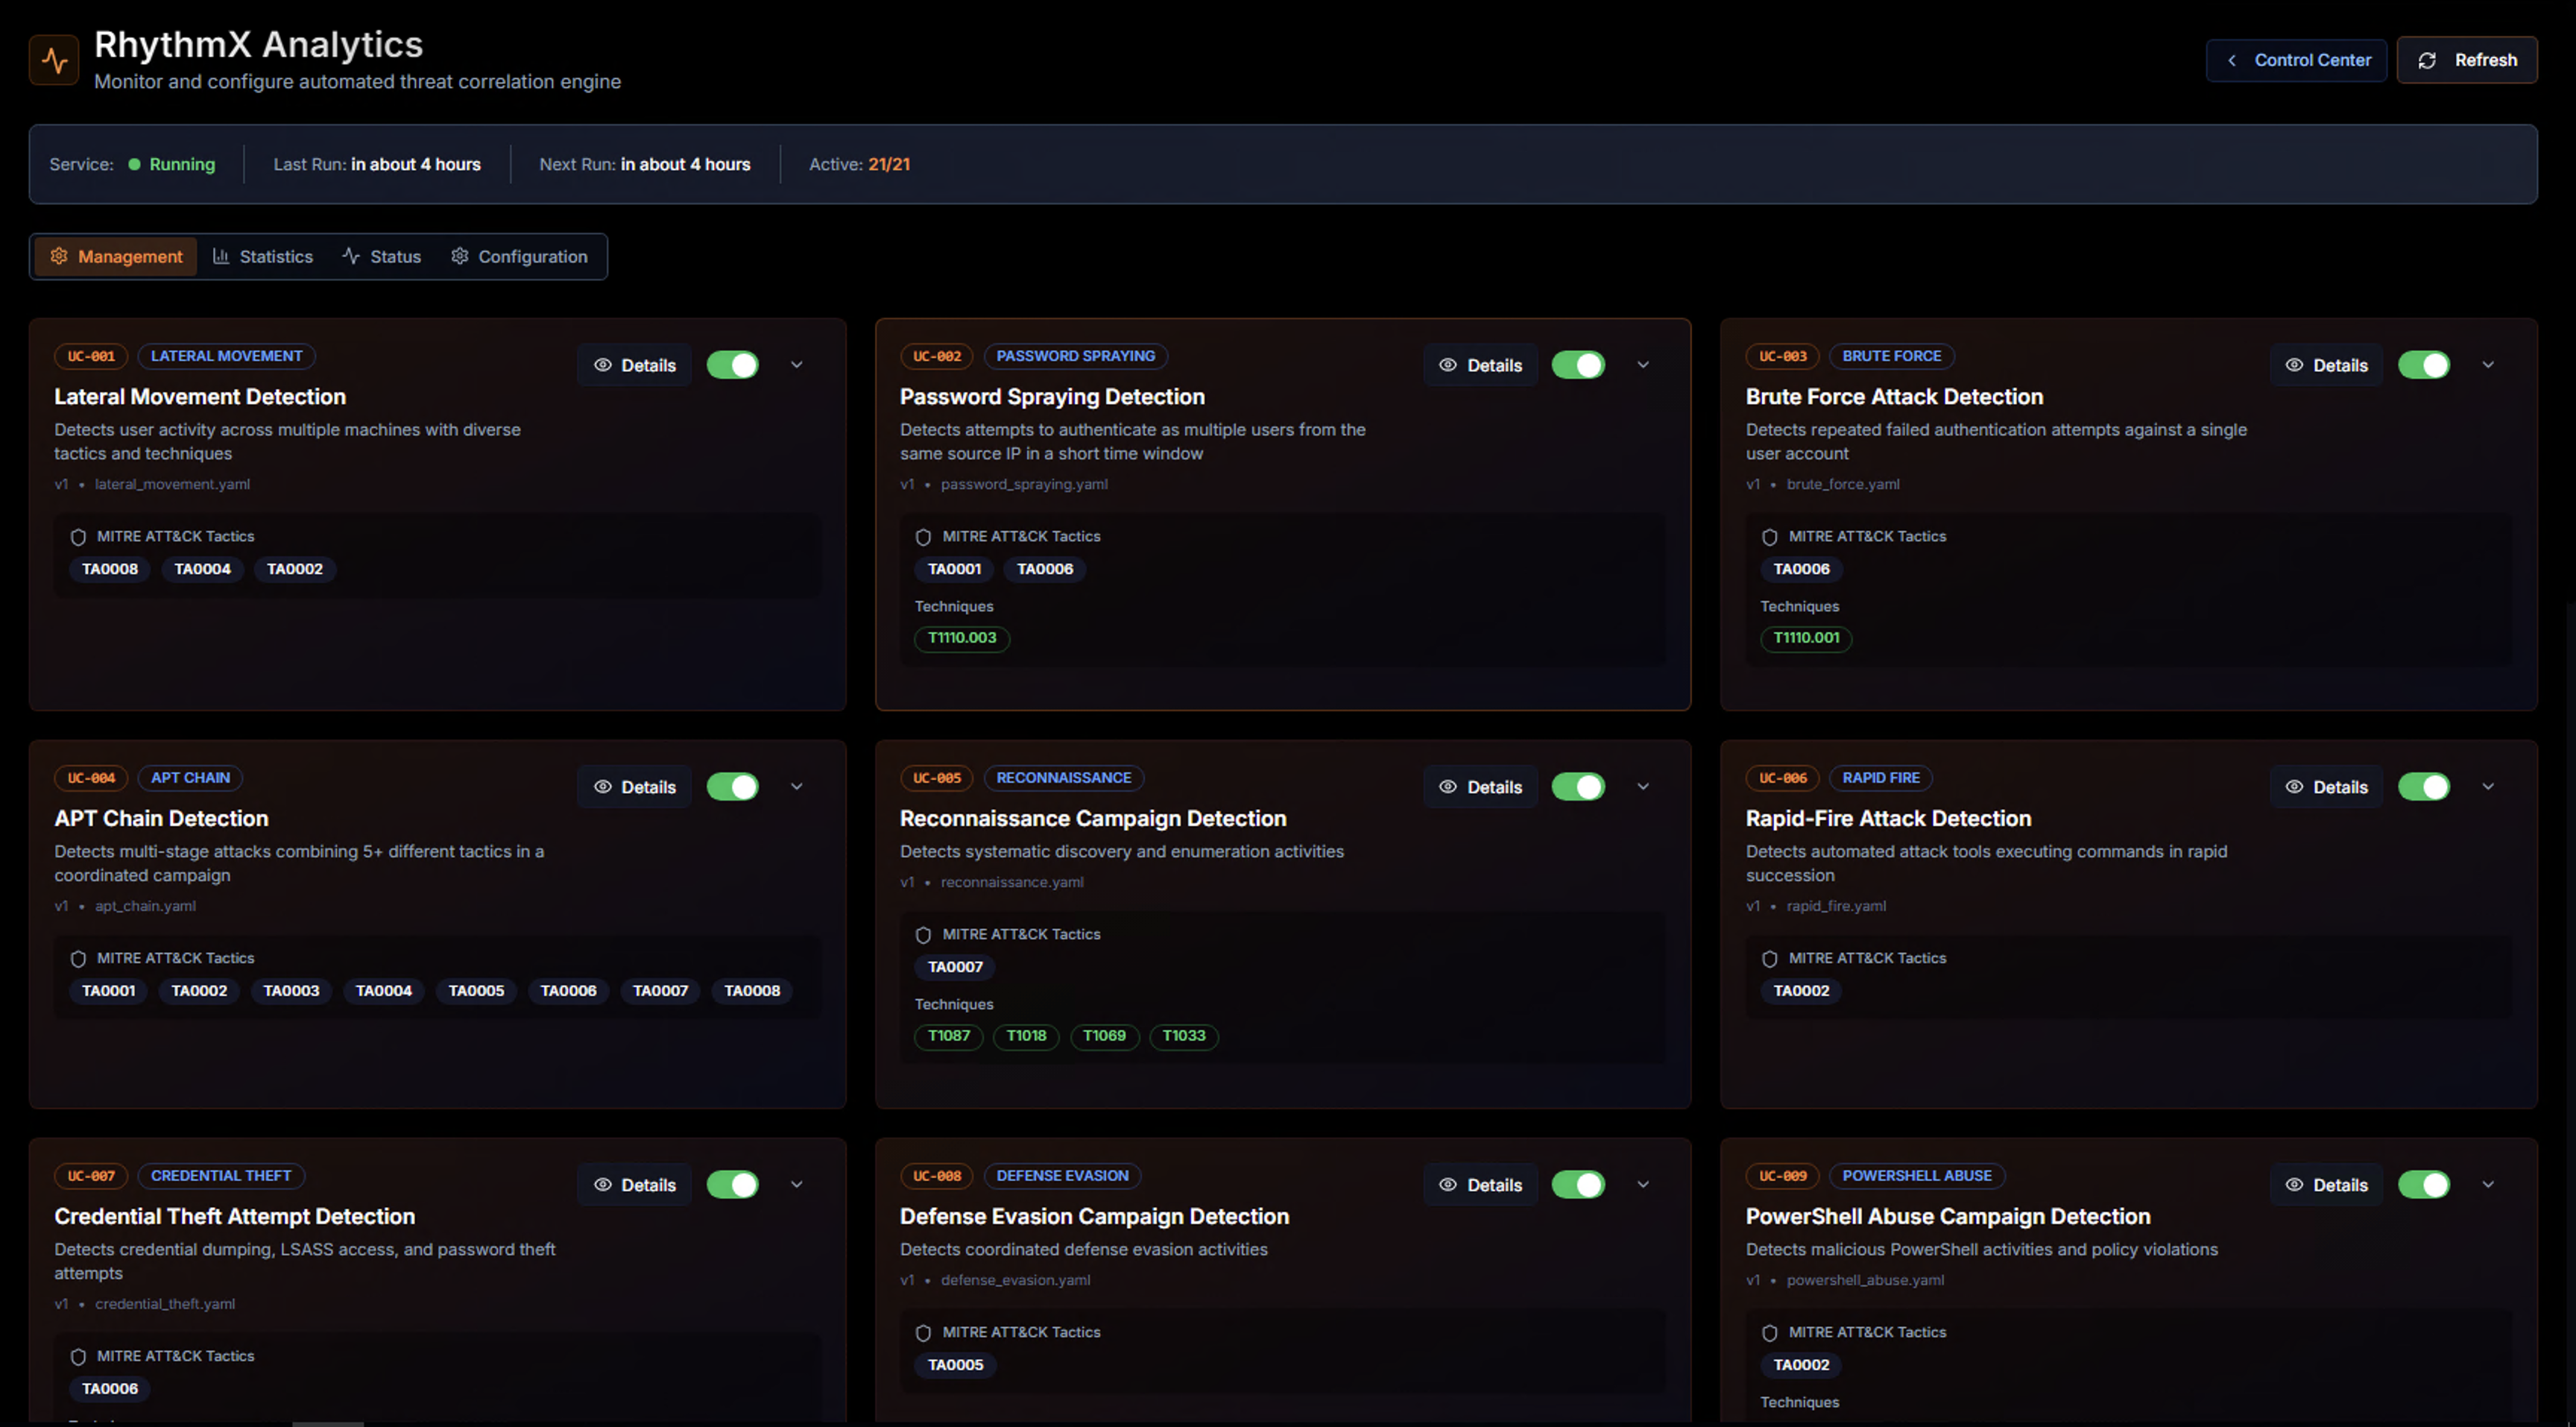
The Management tab displays all available threat correlation use cases as cards. Each card shows:
| Element | Description |
|---|---|
| Use Case ID | Unique identifier (e.g., UC-001) |
| Category tag | The threat category (e.g., LATERAL_MOVEMENT, PASSWORD_SPRAYING, APT_CHAIN) |
| Status badge | Whether the use case is currently enabled |
| Title | Descriptive name of the threat scenario |
| Description | What the use case detects |
| MITRE ATT&CK Tactics | The adversary tactics this use case maps to |
| MITRE ATT&CK Techniques | Specific technique IDs covered |
| Details button | Click to view full use case configuration |
| Enable/Disable toggle | Activate or deactivate the use case |
Available Use Cases
RhythmX includes a comprehensive set of built-in threat correlation use cases:
| Use Case | What It Detects |
|---|---|
| Lateral Movement Detection | User activity across multiple machines with diverse tactics and techniques |
| Password Spraying Detection | Authentication attempts to multiple accounts from the same source in a short time window |
| Brute Force Attack Detection | Repeated failed authentication attempts against a single target |
| APT Chain Detection | Multi-stage attacks combining 3+ different tactics in a coordinated sequence |
| Reconnaissance Campaign Detection | Systematic discovery and enumeration activities |
| Rapid-Fire Attack Detection | Automated attack tools executing commands or rapid succession activities |
| Credential Theft Attempt Detection | Credential dumping, LSASS access, and password theft attempts |
| Defense Evasion Campaign Detection | Coordinated defense evasion activities |
| PowerShell Abuse Campaign Detection | Malicious PowerShell execution patterns and encoded command usage |
| DLL Sideloading/Hijacking Campaign Detection | DLL hijacking or loading malicious DLLs into legitimate processes |
| System Binary Execution Anomaly Detection | Legitimate system binaries (LOLBins) used with suspicious behavior |
| Remote Access Abuse Campaign Detection | Unauthorized remote access tool usage |
| Installer/Package Abuse Detection | Abuse of system installer and package managers for privilege escalation |
| Suspicious Parent-Child Process Relationship Detection | Unusual parent-child process spawning patterns and chains |
| Initial Access to Lateral Movement Chain Detection | Complete attack chain from initial compromise to lateral movement |
| Credential Access Campaign Detection | Multiple credential theft techniques used in combination |
| Ransomware Indicators Detection | Ransomware preparation activities before encryption begins |
| Privilege Escalation Campaign Detection | Coordinated privilege escalation attempts using multiple techniques |
| Persistence Mechanism Detection | Installation of persistent access mechanisms across multiple systems |
| LOLBins Campaign Detection | Coordinated use of living-off-the-land binaries for malicious purposes |
| APT36 Transparent Tribe Campaign Detection | Multi-stage attacks consistent with APT deployment, credential theft, and data exfiltration |
Use Case Details
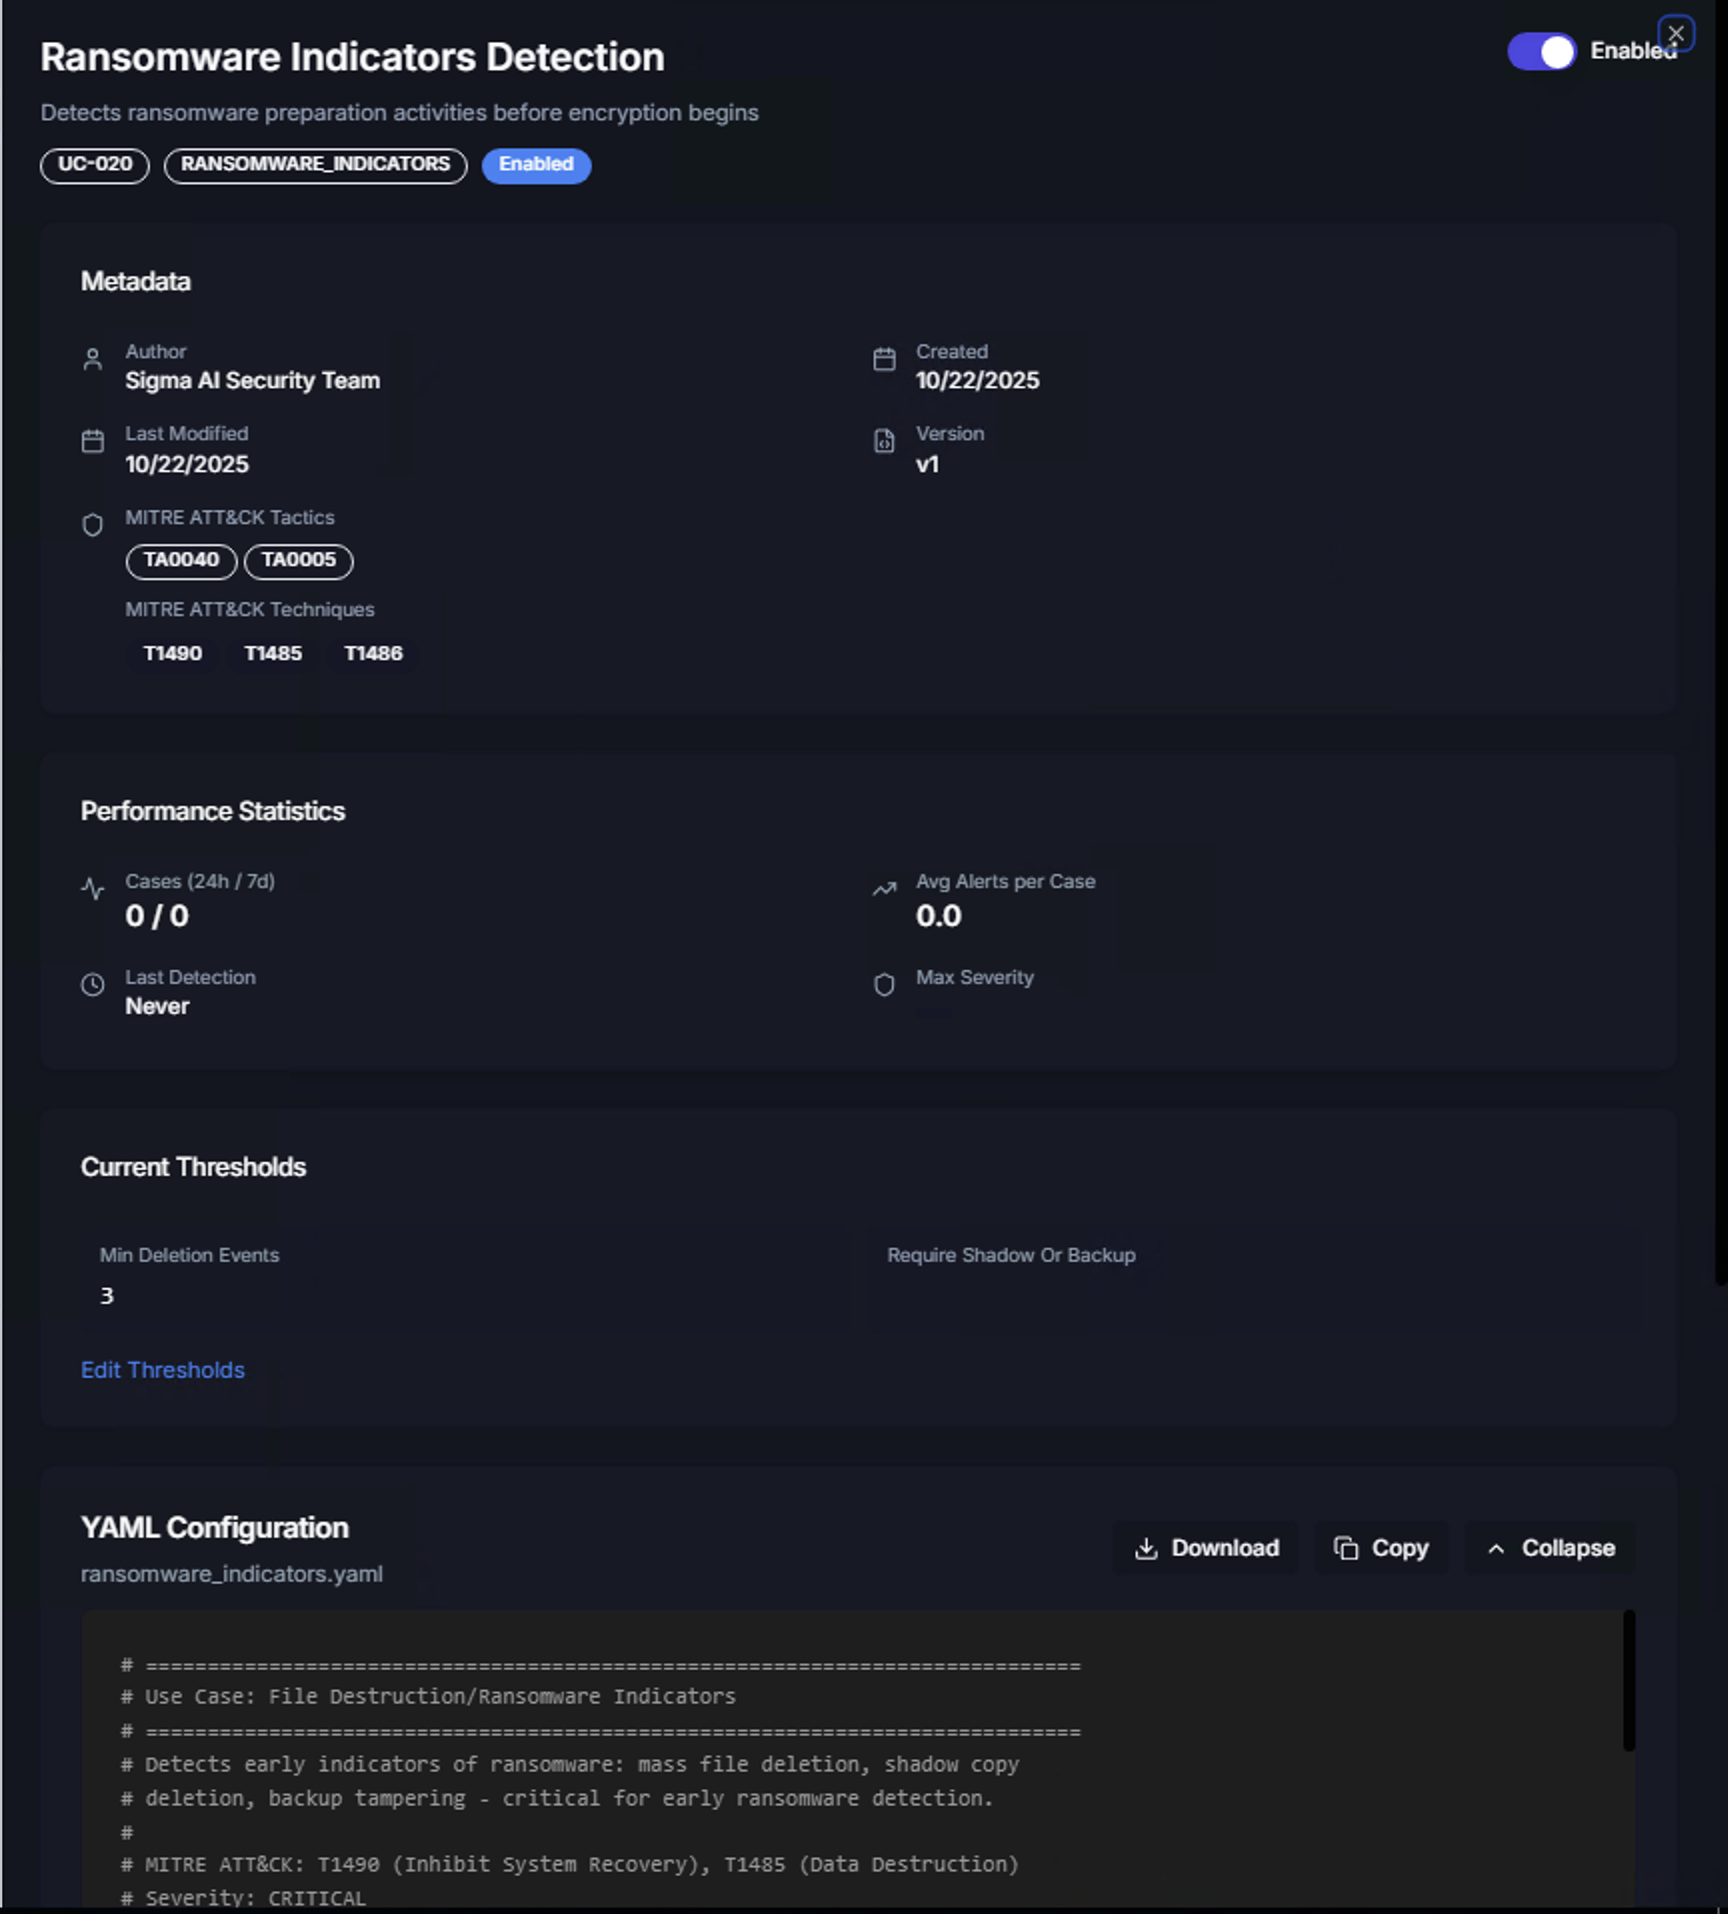
Click Details on any use case card to view its full configuration:
Metadata
| Field | Description |
|---|---|
| Use Case ID | Unique identifier for the correlation rule |
| Category | Threat category tag |
| Author | Who created the use case (e.g., Sigma AI Security Team) |
| Created / Last Modified | Timestamps for version tracking |
| Version | Current version of the use case definition |
| MITRE ATT&CK Tactics | Mapped adversary tactics |
| MITRE ATT&CK Techniques | Mapped technique IDs |
Performance Statistics
| Metric | Description |
|---|---|
| Cases (24h / 7d) | Number of cases generated in the last 24 hours and 7 days |
| Avg Alerts per Case | Average number of correlated alerts per generated case |
| Last Detection | When this use case last triggered |
| Max Severity | The highest severity level among correlated alerts |
Current Thresholds
Each use case has configurable thresholds that control when a correlation triggers. For example, the Ransomware Indicators Detection use case has:
- Min Deletion Events — Minimum number of file deletion events required before triggering (default: 3)
- Require Shadow Or Backup — Whether shadow copy or backup deletion must be present (0 = not required, 1 = required)
Editing Thresholds
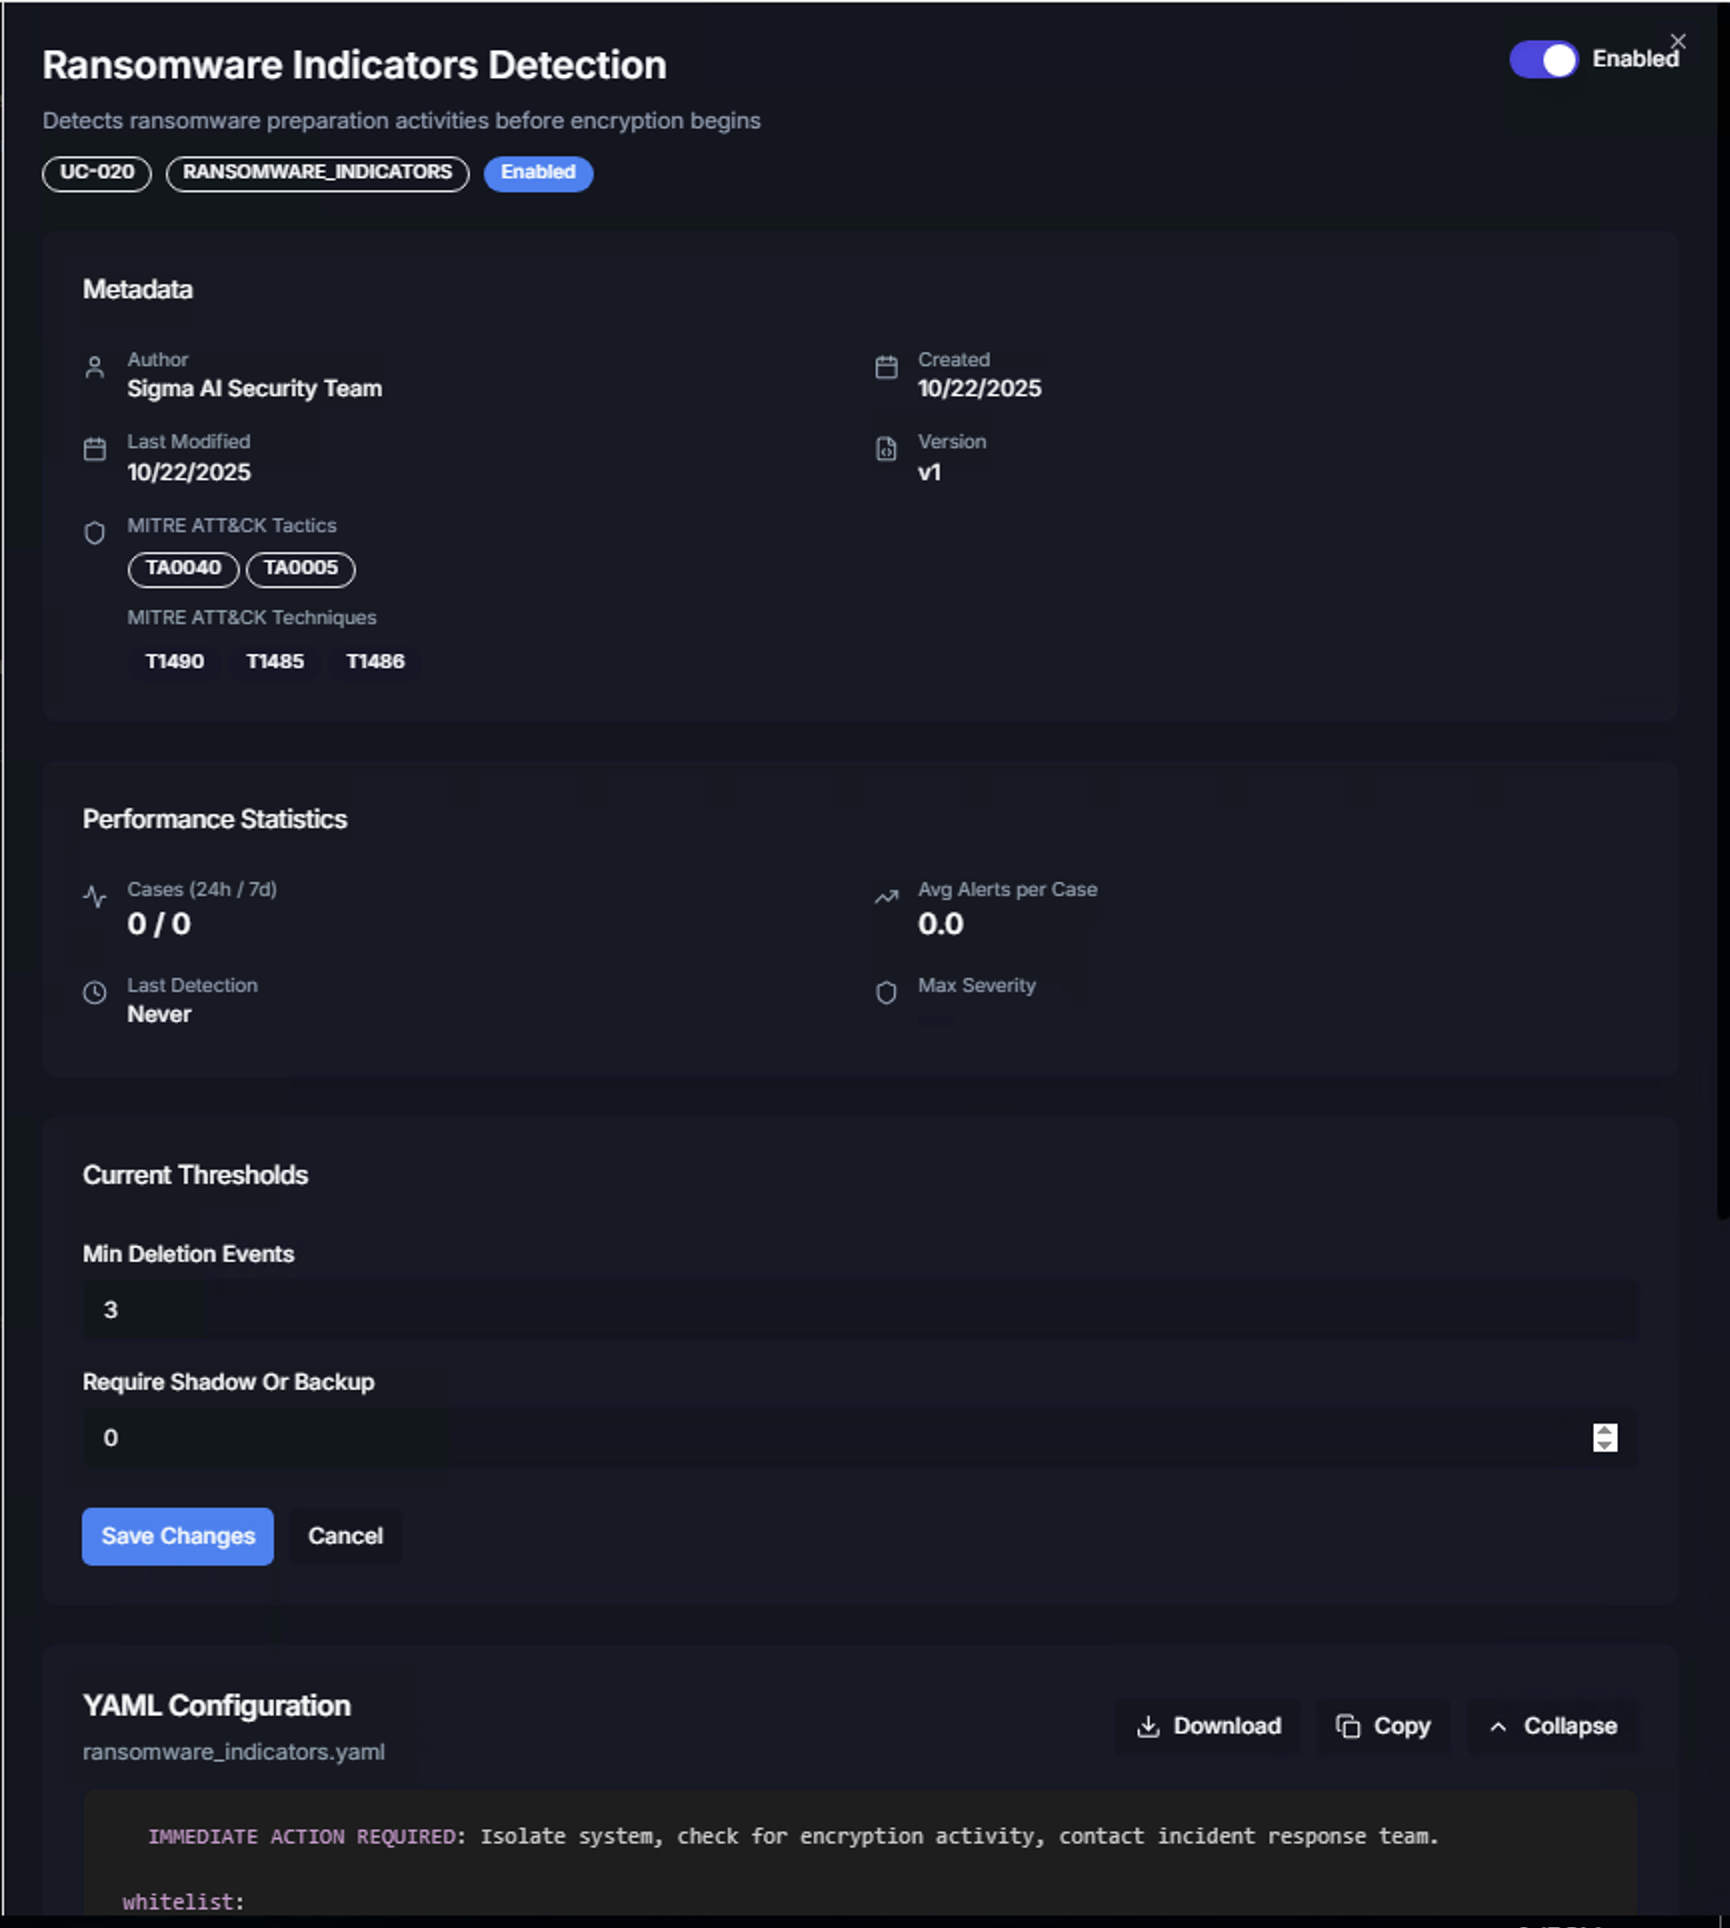
Click Edit Thresholds to modify the trigger conditions. Adjust the values and click Save Changes to apply, or Cancel to discard changes.
Tuning thresholds allows you to:
- Increase thresholds to reduce false positive cases in noisy environments
- Decrease thresholds to catch lower-volume attacks that might otherwise go undetected
- Require specific indicators (e.g., shadow copy deletion for ransomware) to improve detection precision
YAML Configuration
Below the thresholds, the full YAML Configuration for the use case is displayed. This shows the complete correlation logic including:
- Use case description and detection rationale
- MITRE ATT&CK mappings
- Alert correlation criteria
- Threshold definitions
- Immediate action instructions (e.g., "Isolate system, check for encryption activity, contact incident response team")
Use the Download, Copy, or Collapse buttons to export or manage the YAML definition.
Statistics Tab
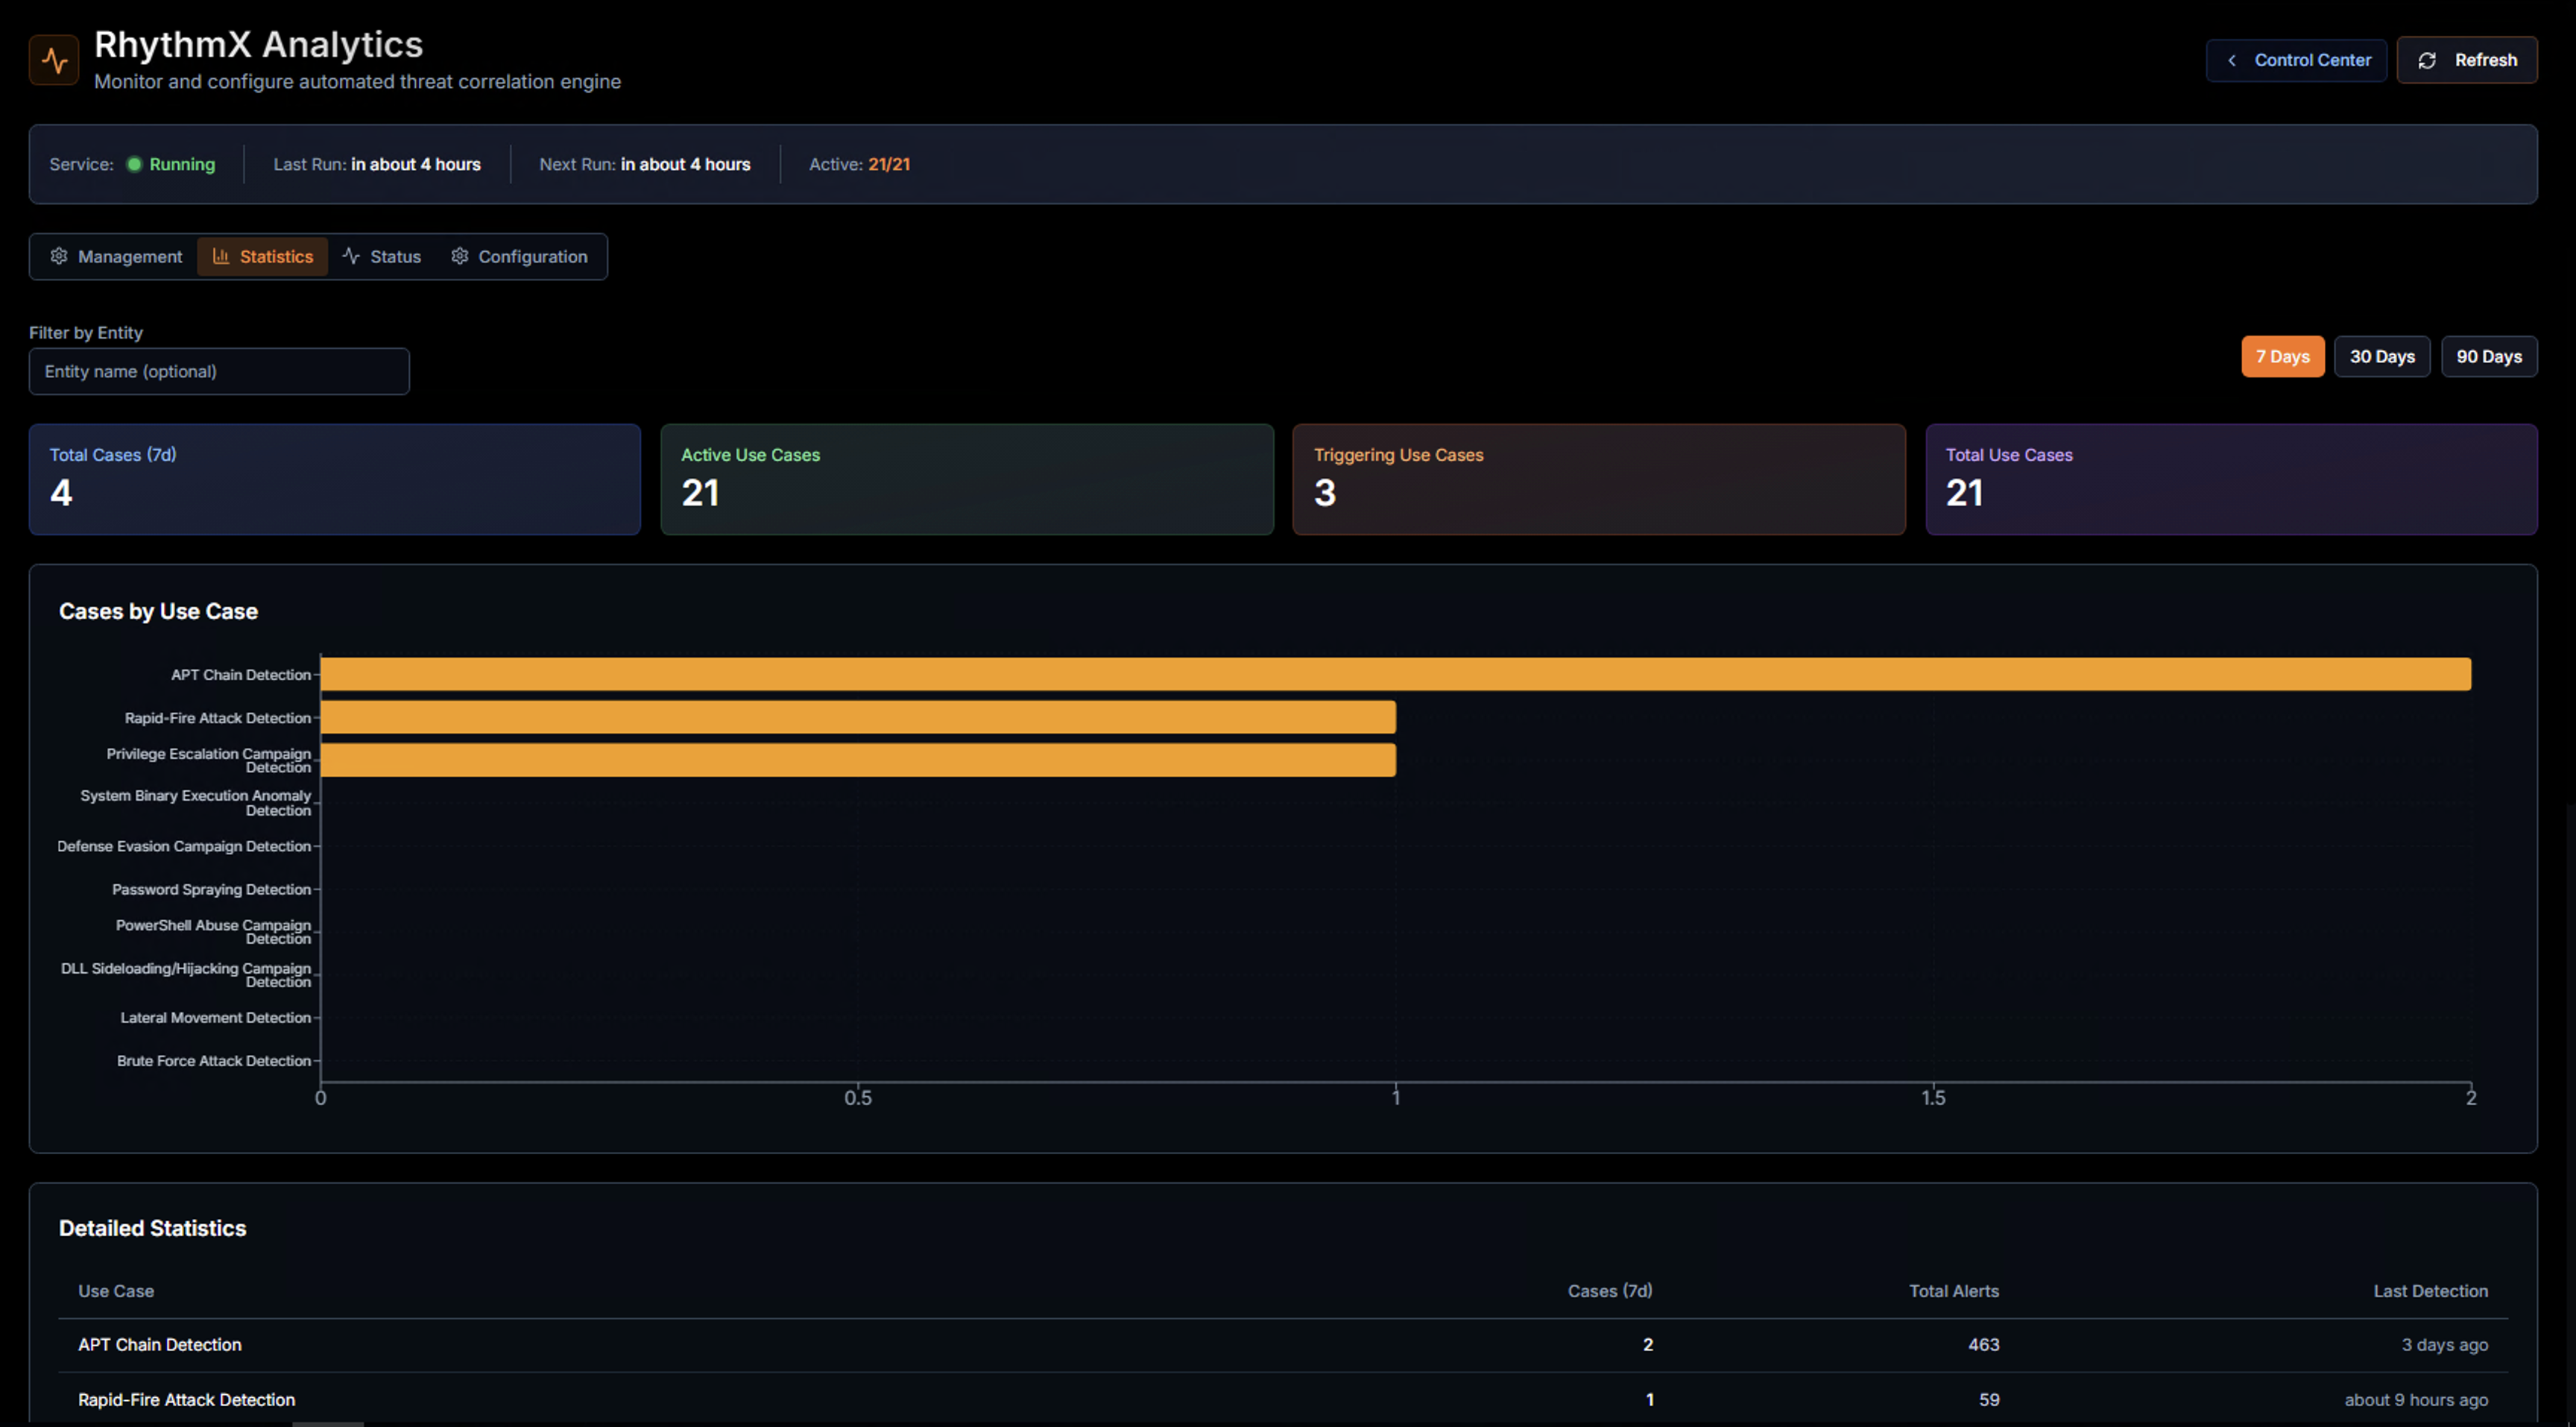
The Statistics tab provides an overview of the correlation engine's performance.
KPIs
| KPI | Description |
|---|---|
| Total Cases (7d) | Number of correlation cases generated in the selected time period |
| Active Use Cases | Use cases currently enabled and running |
| Triggering Use Cases | Use cases that have generated at least one case in the selected period |
| Total Use Cases | Total number of available use cases (active + disabled) |
Use the time range buttons (7 Days, 30 Days, 90 Days) to adjust the reporting period. Filter by entity using the Filter by Entity field.
Cases by Use Case
A horizontal bar chart shows which use cases are generating the most cases. This helps identify:
- High-volume use cases — May need threshold tuning if generating too many cases
- Silent use cases — Use cases that haven't triggered may need lower thresholds or may indicate good security posture
- Trending threats — Use cases that suddenly start triggering indicate new attack activity
Detailed Statistics Table
| Column | Description |
|---|---|
| Use Case | Correlation use case name |
| Cases (7d) | Number of cases generated in the selected period |
| Total Alerts | Total correlated alerts across all cases |
| Last Detection | When the use case last triggered |
Status Tab
The Status tab shows the real-time health of the analytics engine, including service uptime, last execution results, and any errors encountered during correlation cycles.
Configuration Tab
The Configuration tab allows admins to adjust global analytics engine settings such as:
- Correlation cycle frequency
- Case generation thresholds
- Entity grouping preferences
- Notification settings for new cases