Security Alarms
Security Alarms is the SOC-grade alarm management interface that unifies detections from two sources — RhythmX Intelligence (Sigma behavioral detections and ML anomalies) and LogRhythm Signals (native SIEM alarms) — into a single investigation cockpit. Alarms are automatically grouped by actor, enriched with MITRE ATT&CK mappings, and scored using a multi-factor risk model.
Access Security Alarms from the top navigation bar by clicking Alarms.

How Alarms Work
RhythmX ingests alarms from two detection engines and stitches them together per actor:
| Source | What It Detects | Where It Comes From |
|---|---|---|
| RhythmX Intelligence | Behavioral detections from Sigma rules and ML anomaly detection | RhythmX's own detection engine — behavioral rules, ML-powered anomaly scoring, and automated threat correlation |
| LogRhythm Signals | Native SIEM alarms and operational detections | LogRhythm's alarm history — provides access to 90+ days of alarm data |
Both sources are merged under each actor (user, host, or IP) to provide a unified view of all suspicious activity associated with that identity.
Alarm Views
Card View
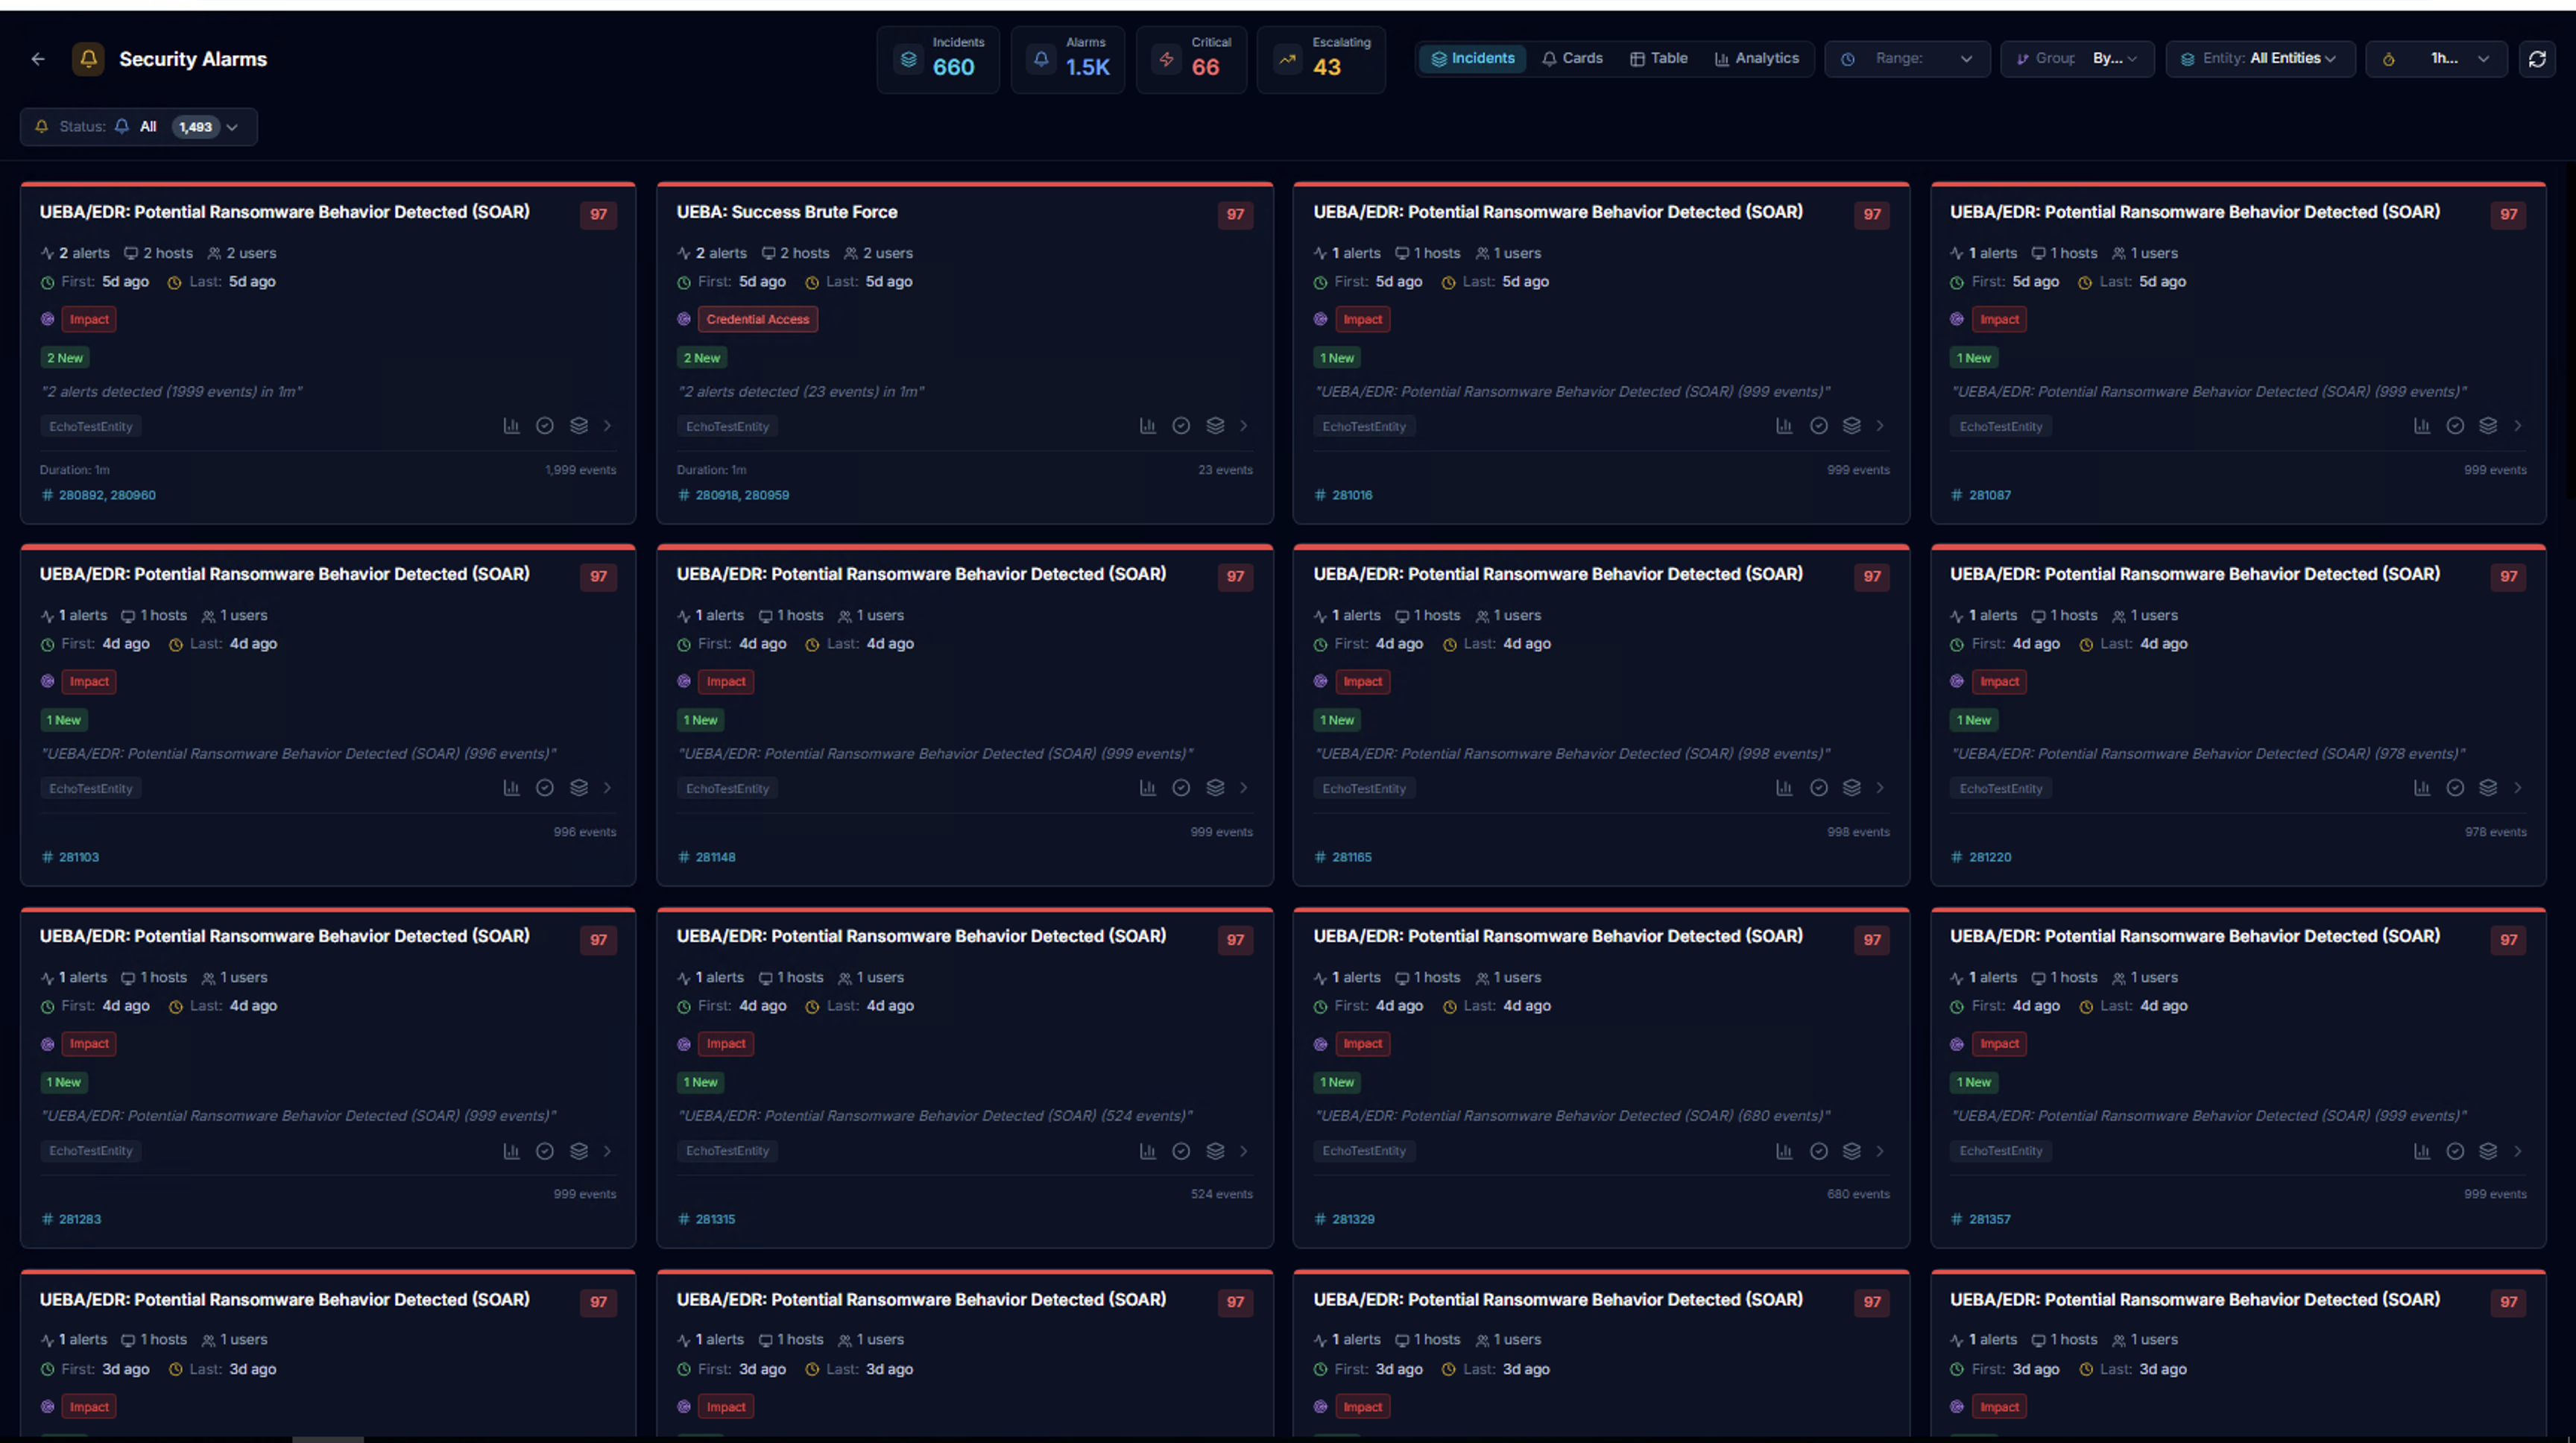
The default view displays alarms as cards grouped by alarm rule. KPIs at the top show aggregate counts across all alarms.
Actor View
Switch to the actor-based view to see alarms grouped by user identity. Each actor card shows:
| Element | Description |
|---|---|
| Actor name | The user, host, or IP address |
| Risk badge | Color-coded risk level |
| Alarm count | Total alarms and MITRE technique count |
| MITRE tactic badges | Color-coded pills showing detected tactics (Discovery, Lateral Movement, Credential Access, Persistence, Privilege Escalation, etc.) |
| Risk bar | Visual gradient showing the risk distribution across alarms |
| Date range | First seen to last seen timestamps |
| Entity | Which LogRhythm entity the activity was detected in |
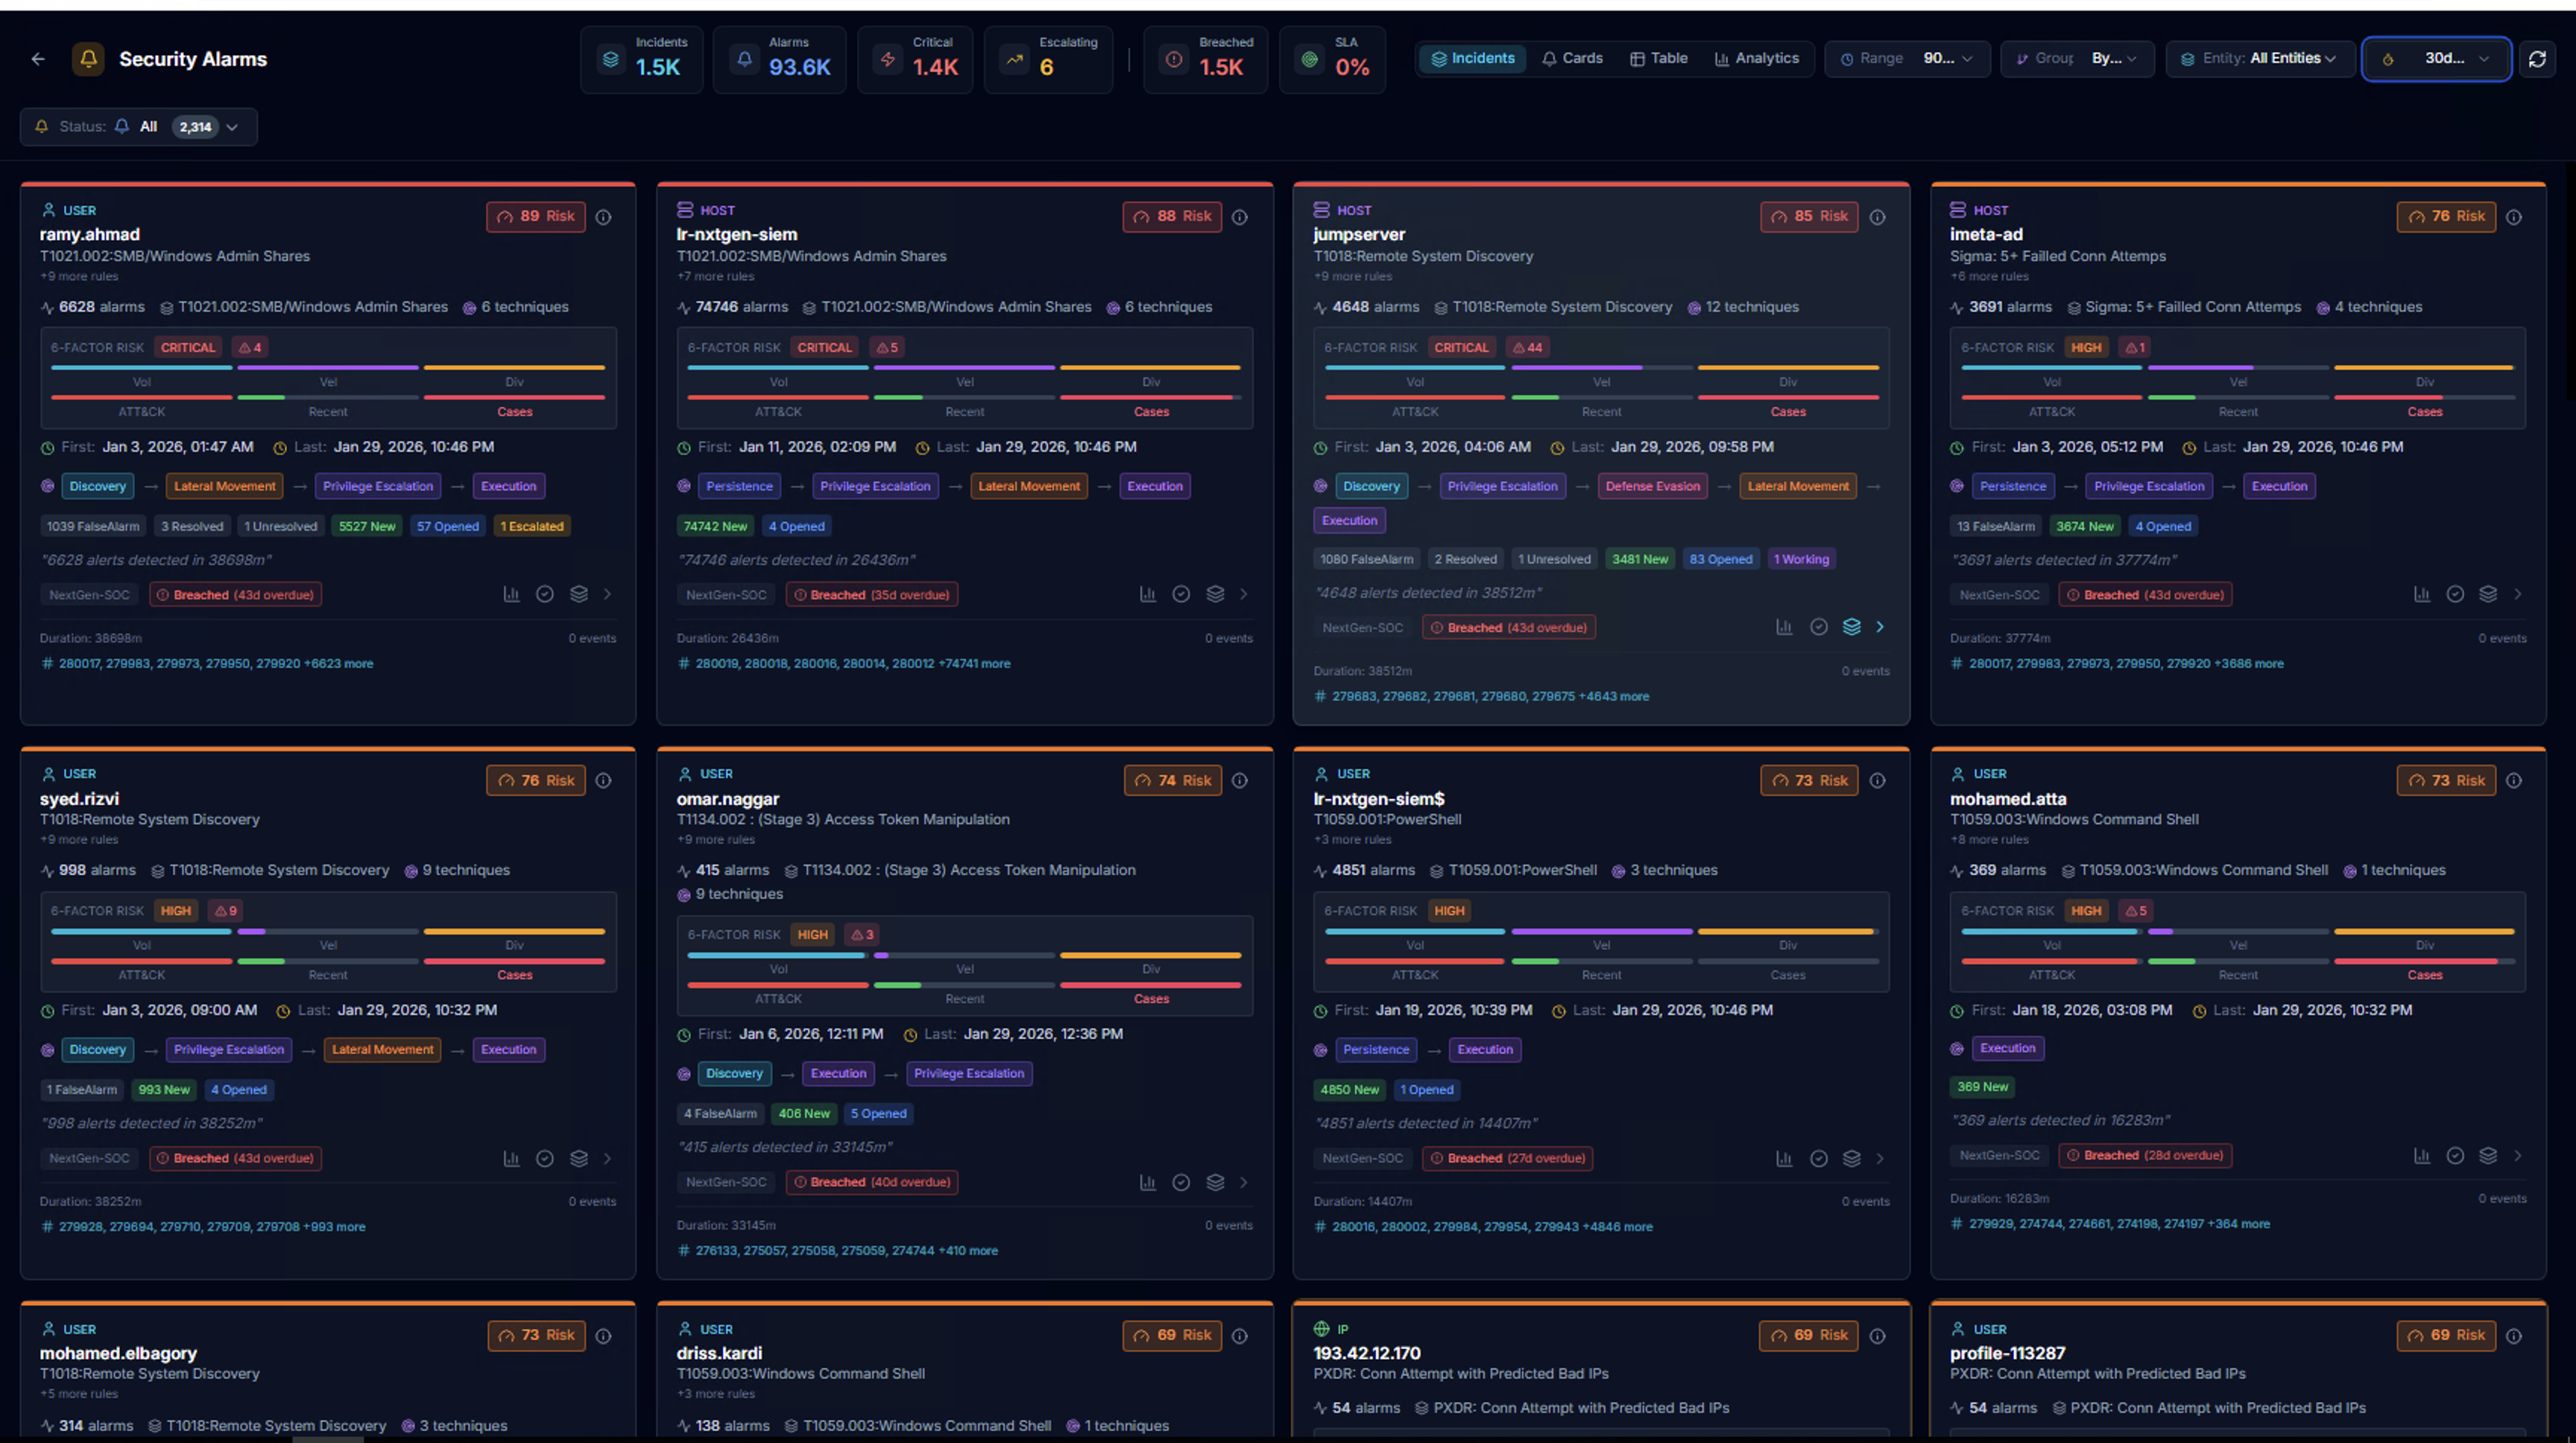
Incidents View
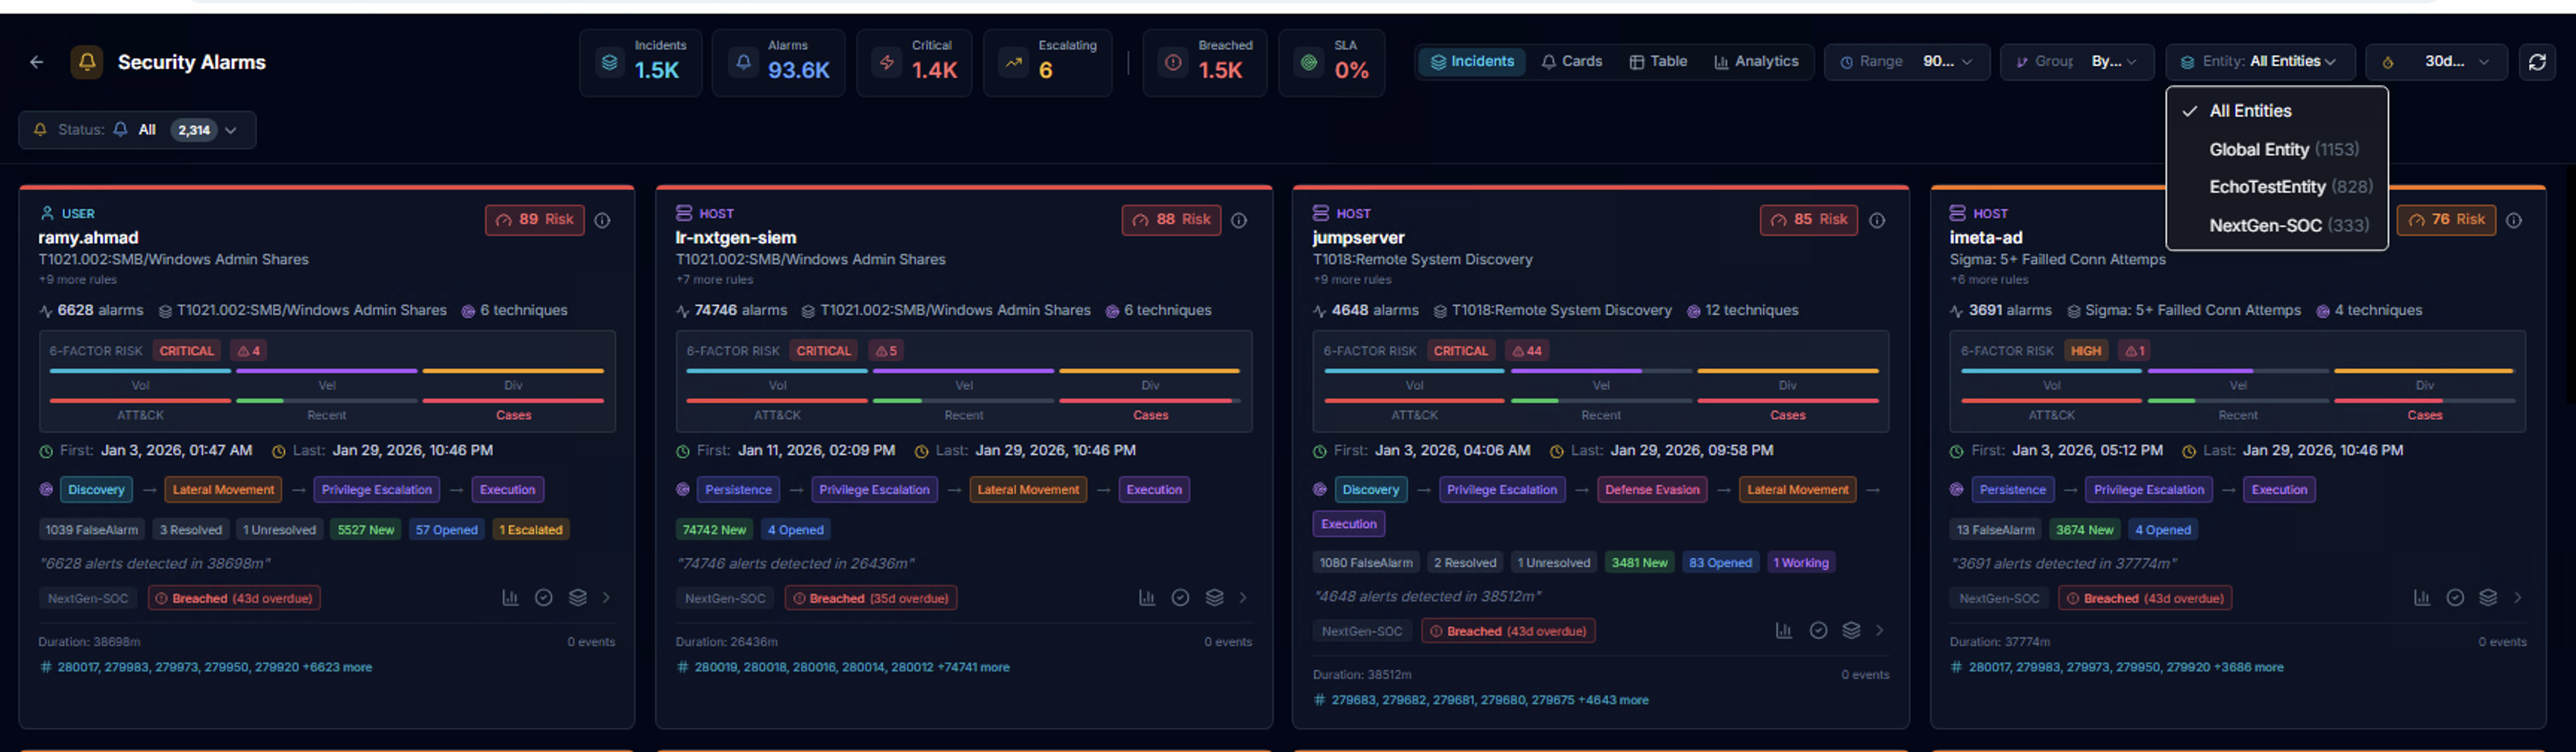
The Incidents tab groups alarms into incidents per actor. Use the Entity dropdown to filter by organization (e.g., Global Entity, NextGen-SOC). Each incident card includes:
- 6-FACTOR RISK score with CRITICAL/HIGH/MEDIUM/LOW badge
- Alarm status breakdown (New, Opened, Escalated, Resolved, False Alarm)
- SLA status indicator (Breached, On Track, At Risk)
- MITRE tactic coverage
- Alarm IDs for reference
Status Filtering
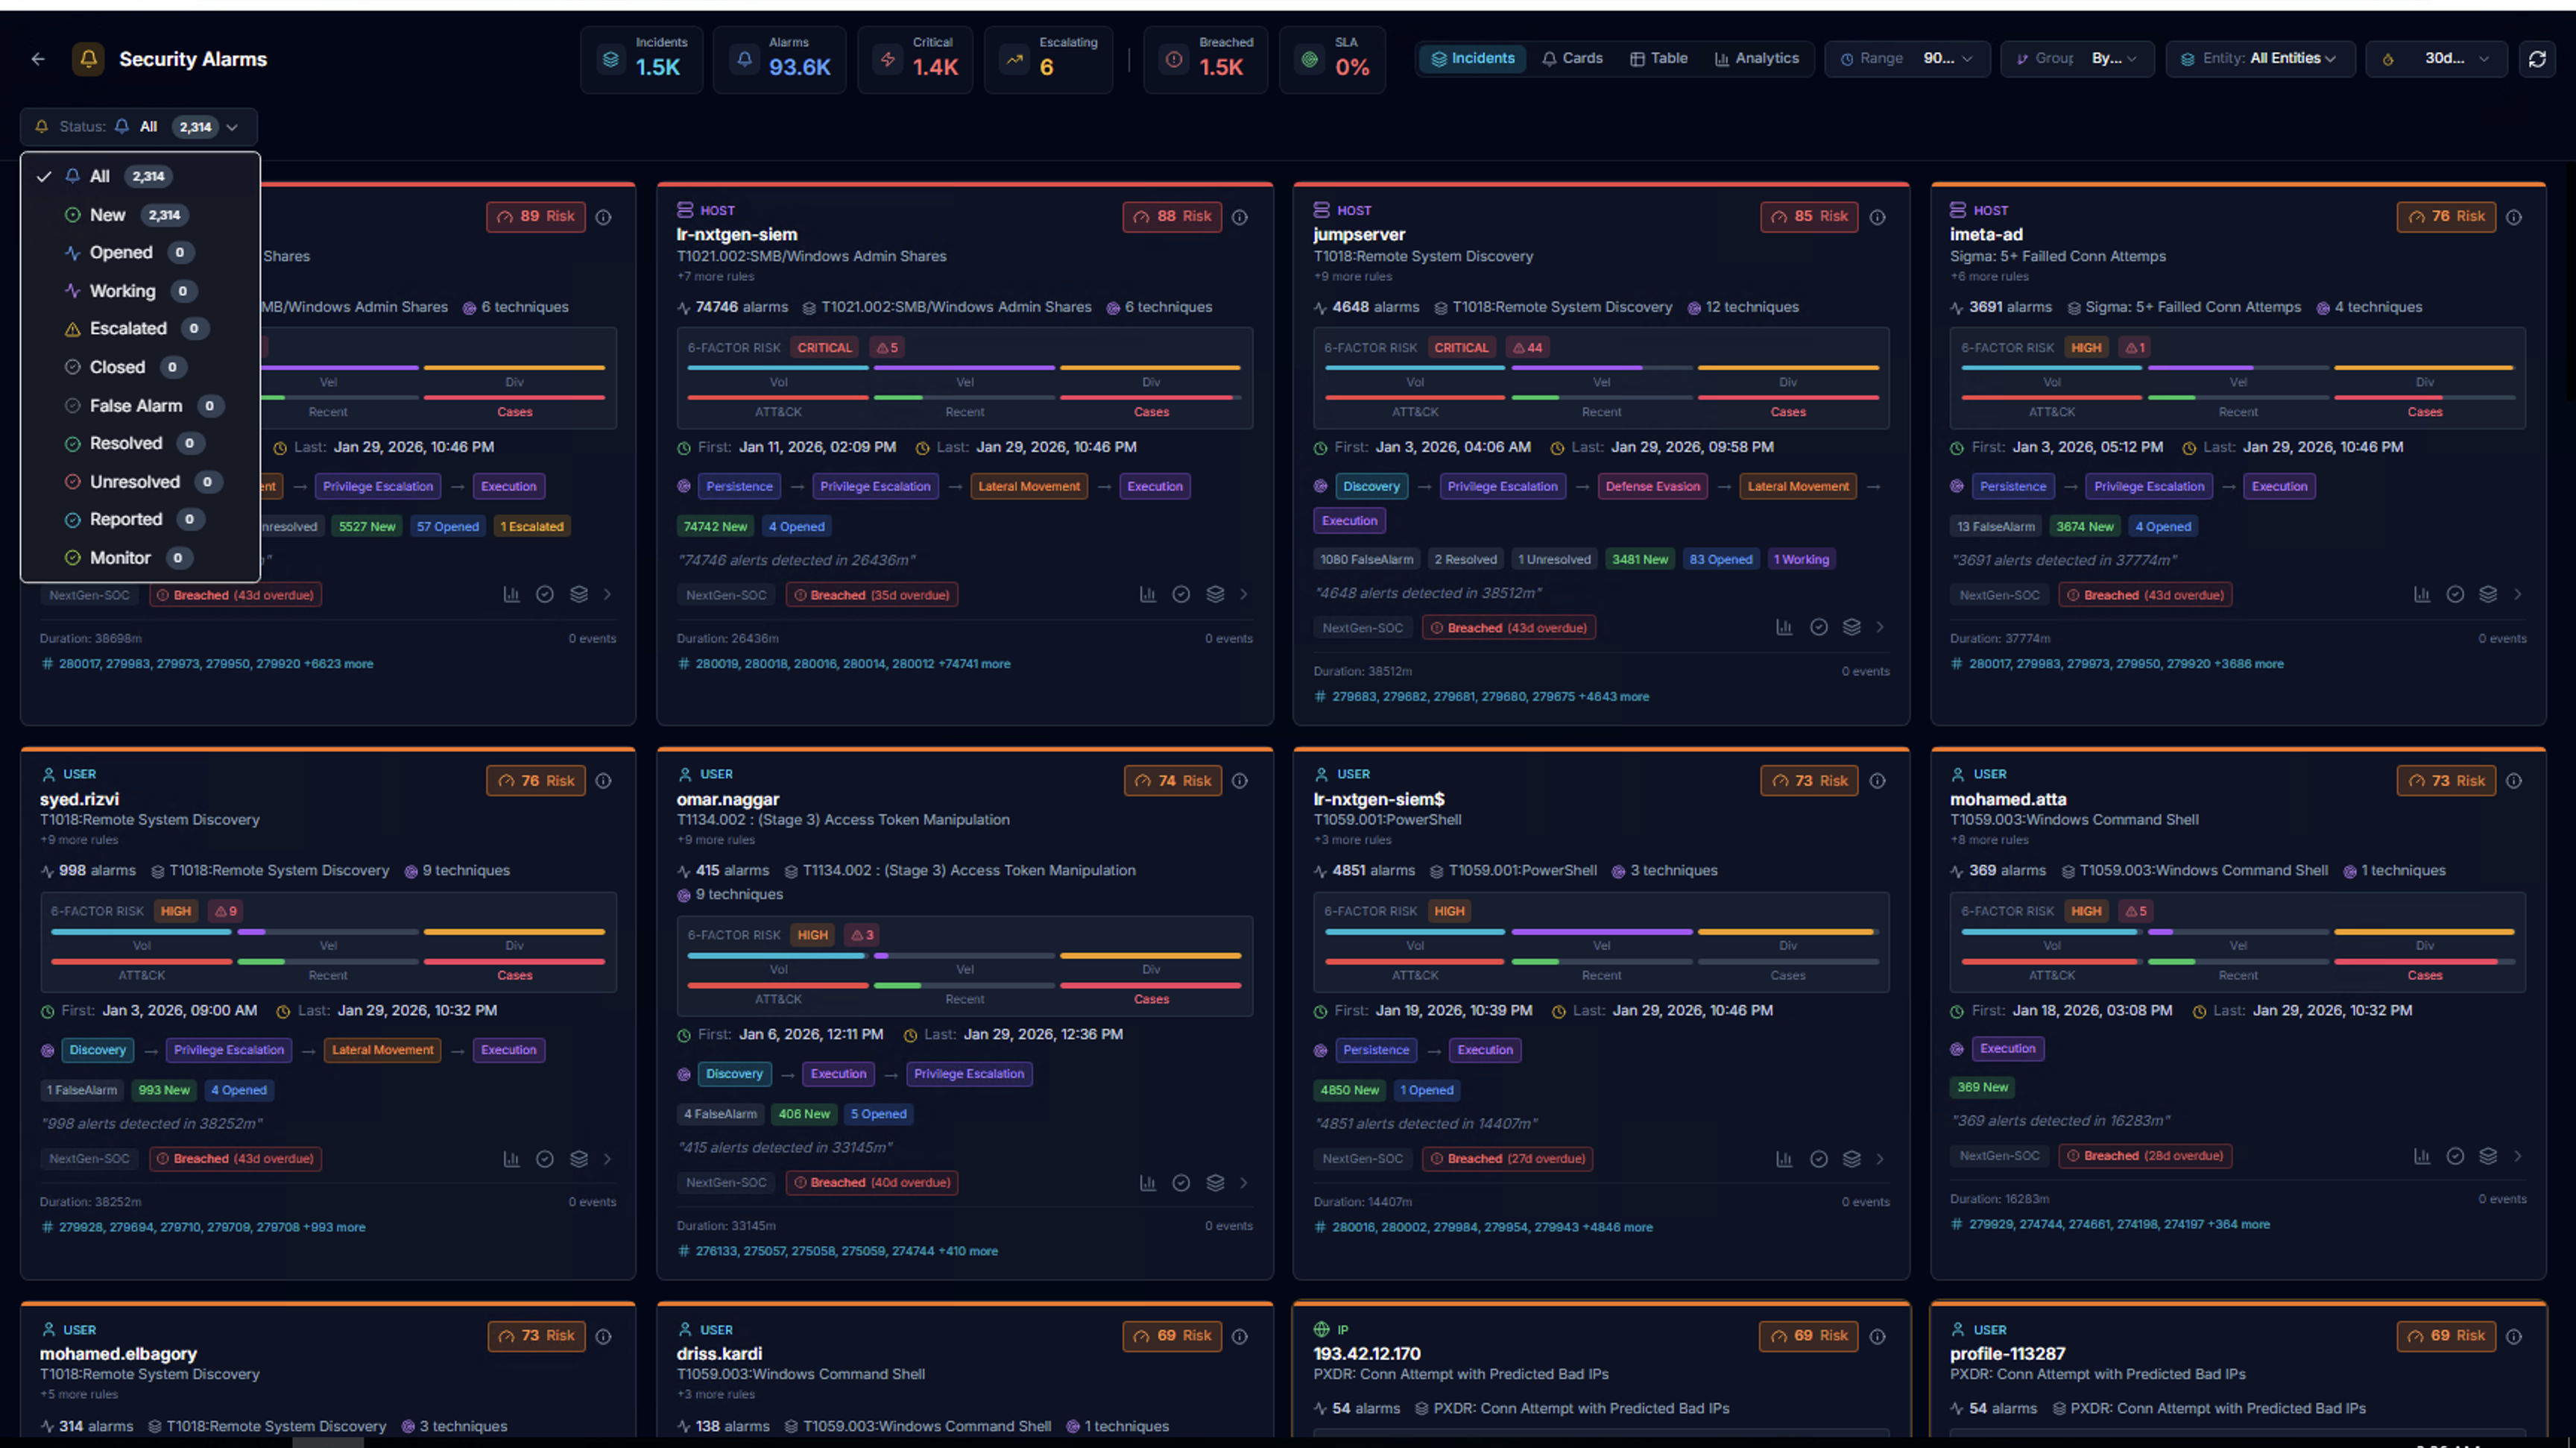
Filter alarms by lifecycle status:
| Status | Description |
|---|---|
| All | Show all alarms |
| New | Newly created, not yet reviewed |
| Opened | Analyst has opened for review |
| Escalated | Escalated to a higher tier |
| Closed | Investigation complete |
| False Alarm | Determined to be benign |
| Resolved | Issue has been remediated |
| Unresolved | Investigation inconclusive |
| Reported | Reported to management |
| Monitor | Under ongoing monitoring |
Actor Investigation
Source Split
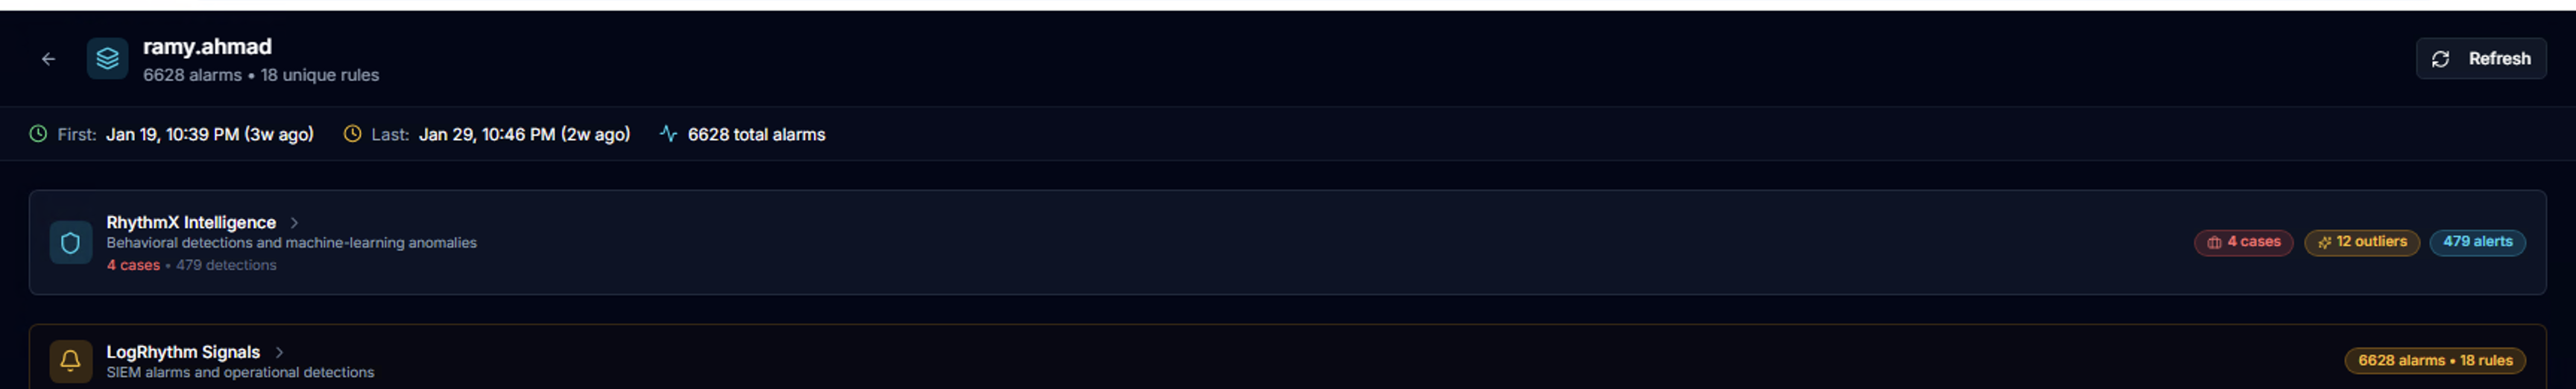
Click any actor card to open the detail view. The actor header shows:
- Actor name and total alarm count with unique rule count
- First seen / Last seen timestamps with relative age
- Total alarms across both sources
Below, the two detection sources are displayed:
| Source | What It Shows |
|---|---|
| RhythmX Intelligence | Behavioral detections and ML anomalies — cases, outliers, and alert counts |
| LogRhythm Signals | SIEM alarms and operational detections — alarm count and rule count |
This split view is the core of how RhythmX stitches together multiple detection engines for a single actor.
RhythmX Intelligence
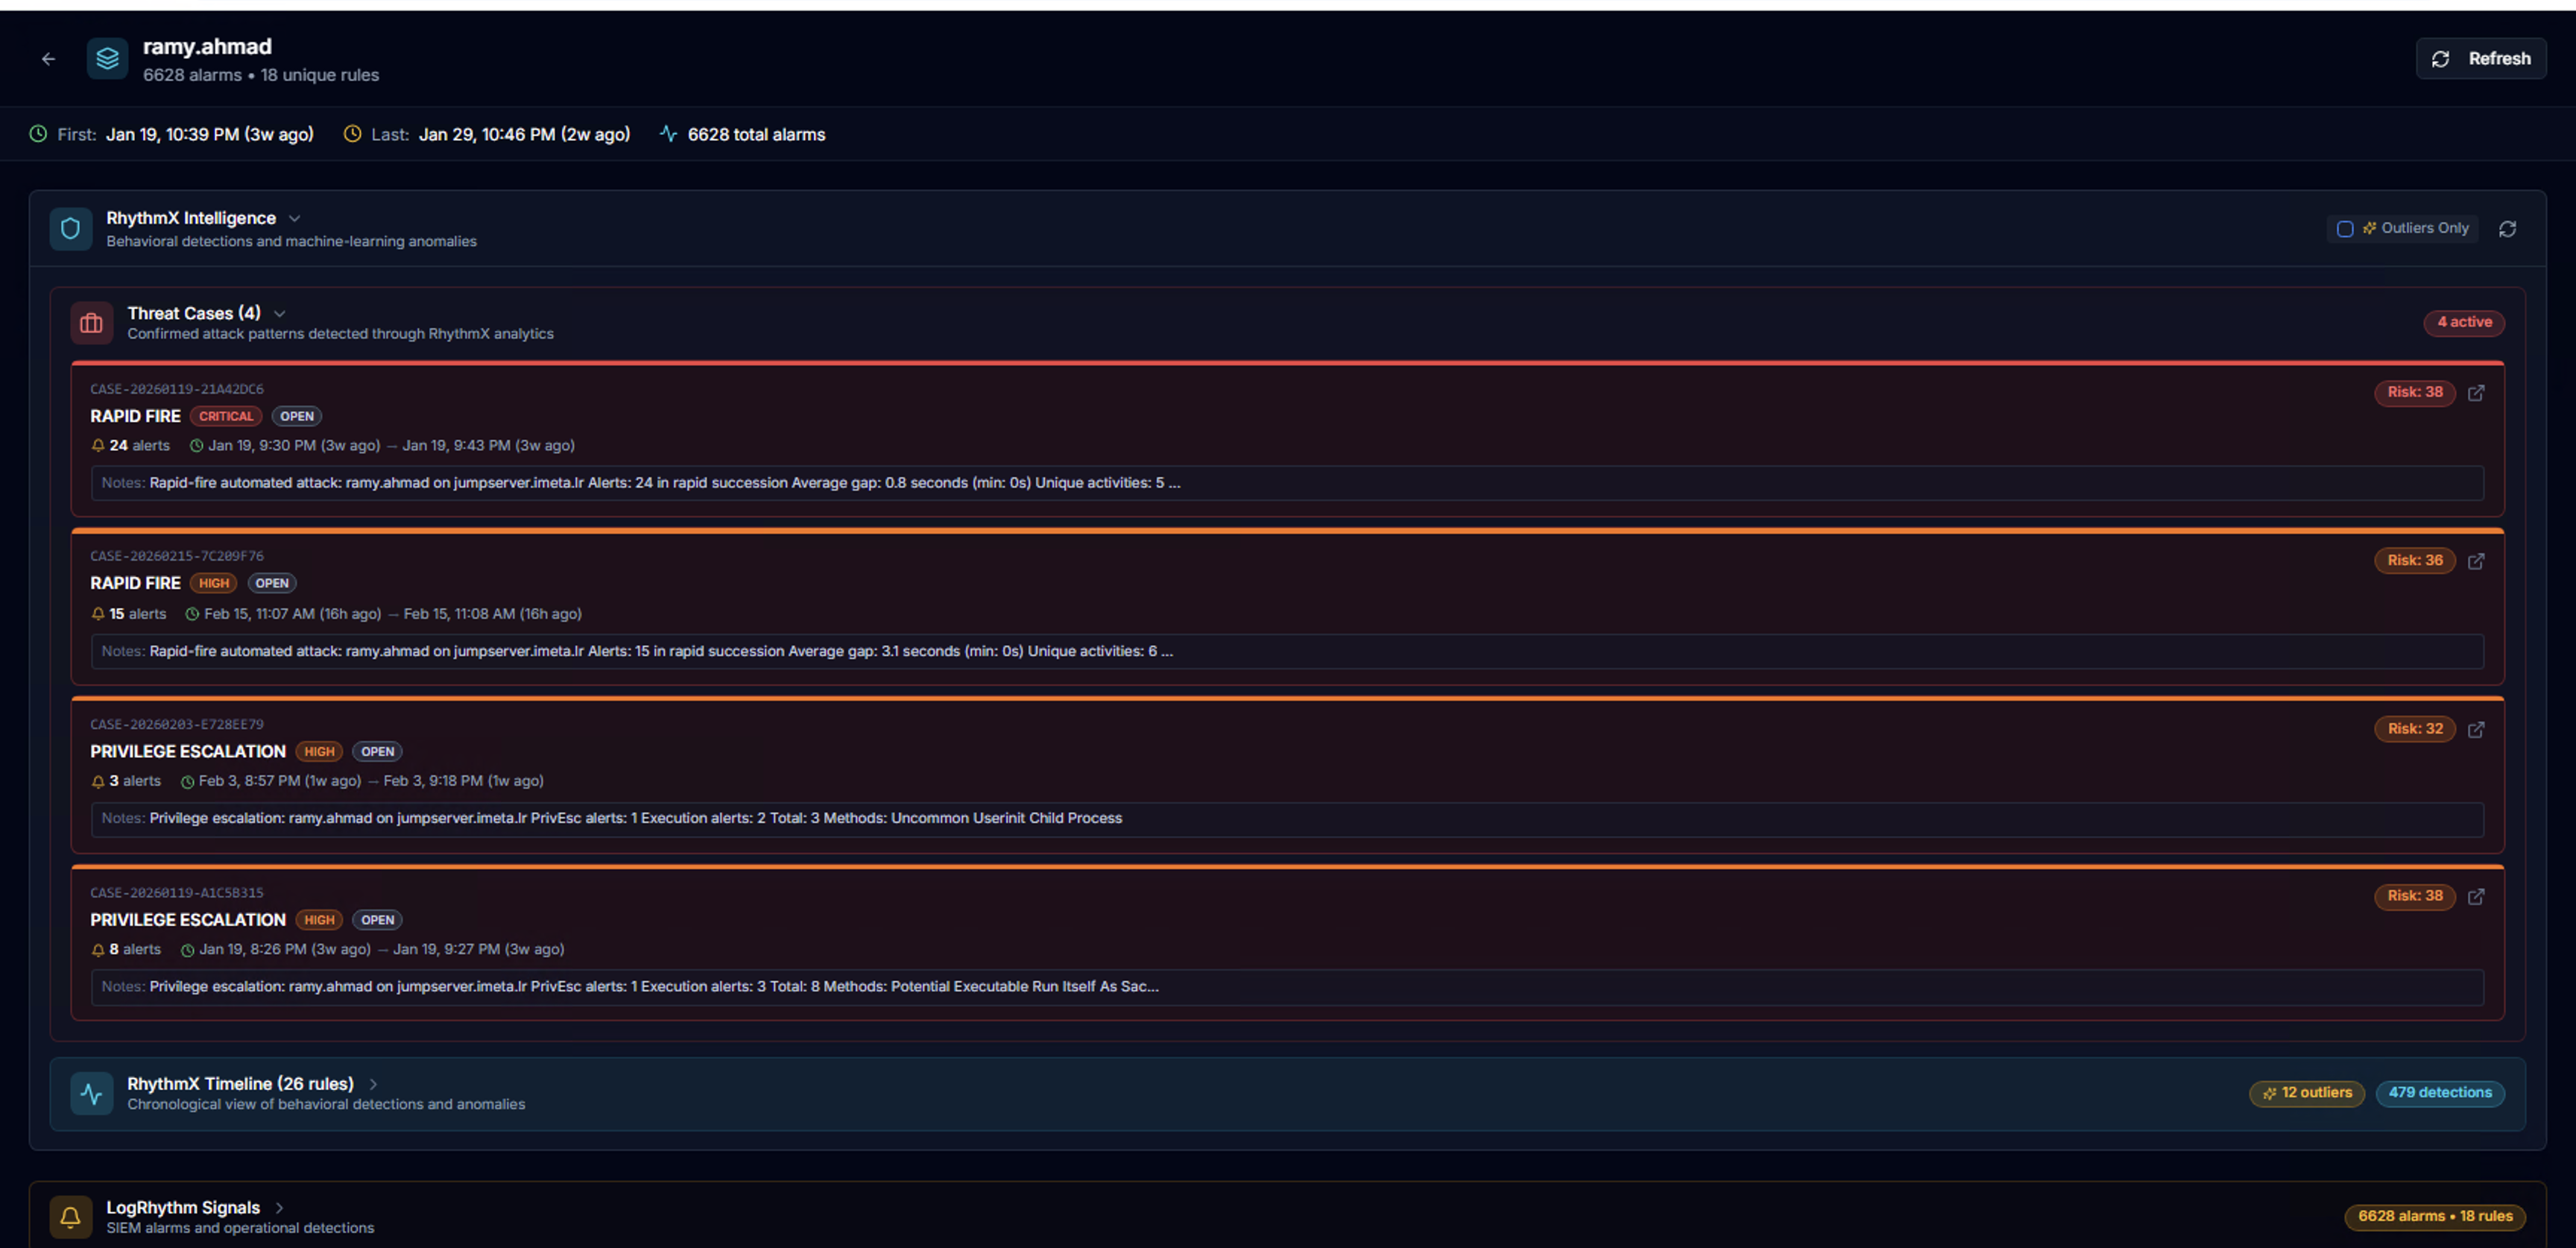
Expand RhythmX Intelligence to see:
Threat Cases — Correlated attack patterns detected by the RhythmX Analytics correlation engine. Each case shows:
- Case type and severity (e.g., RAPID FIRE — CRITICAL, PRIVILEGE ESCALATION — HIGH)
- Status badge (OPEN)
- Alert count and risk score
- Date range
- Description of the detected pattern (e.g., methods used, succession timing)
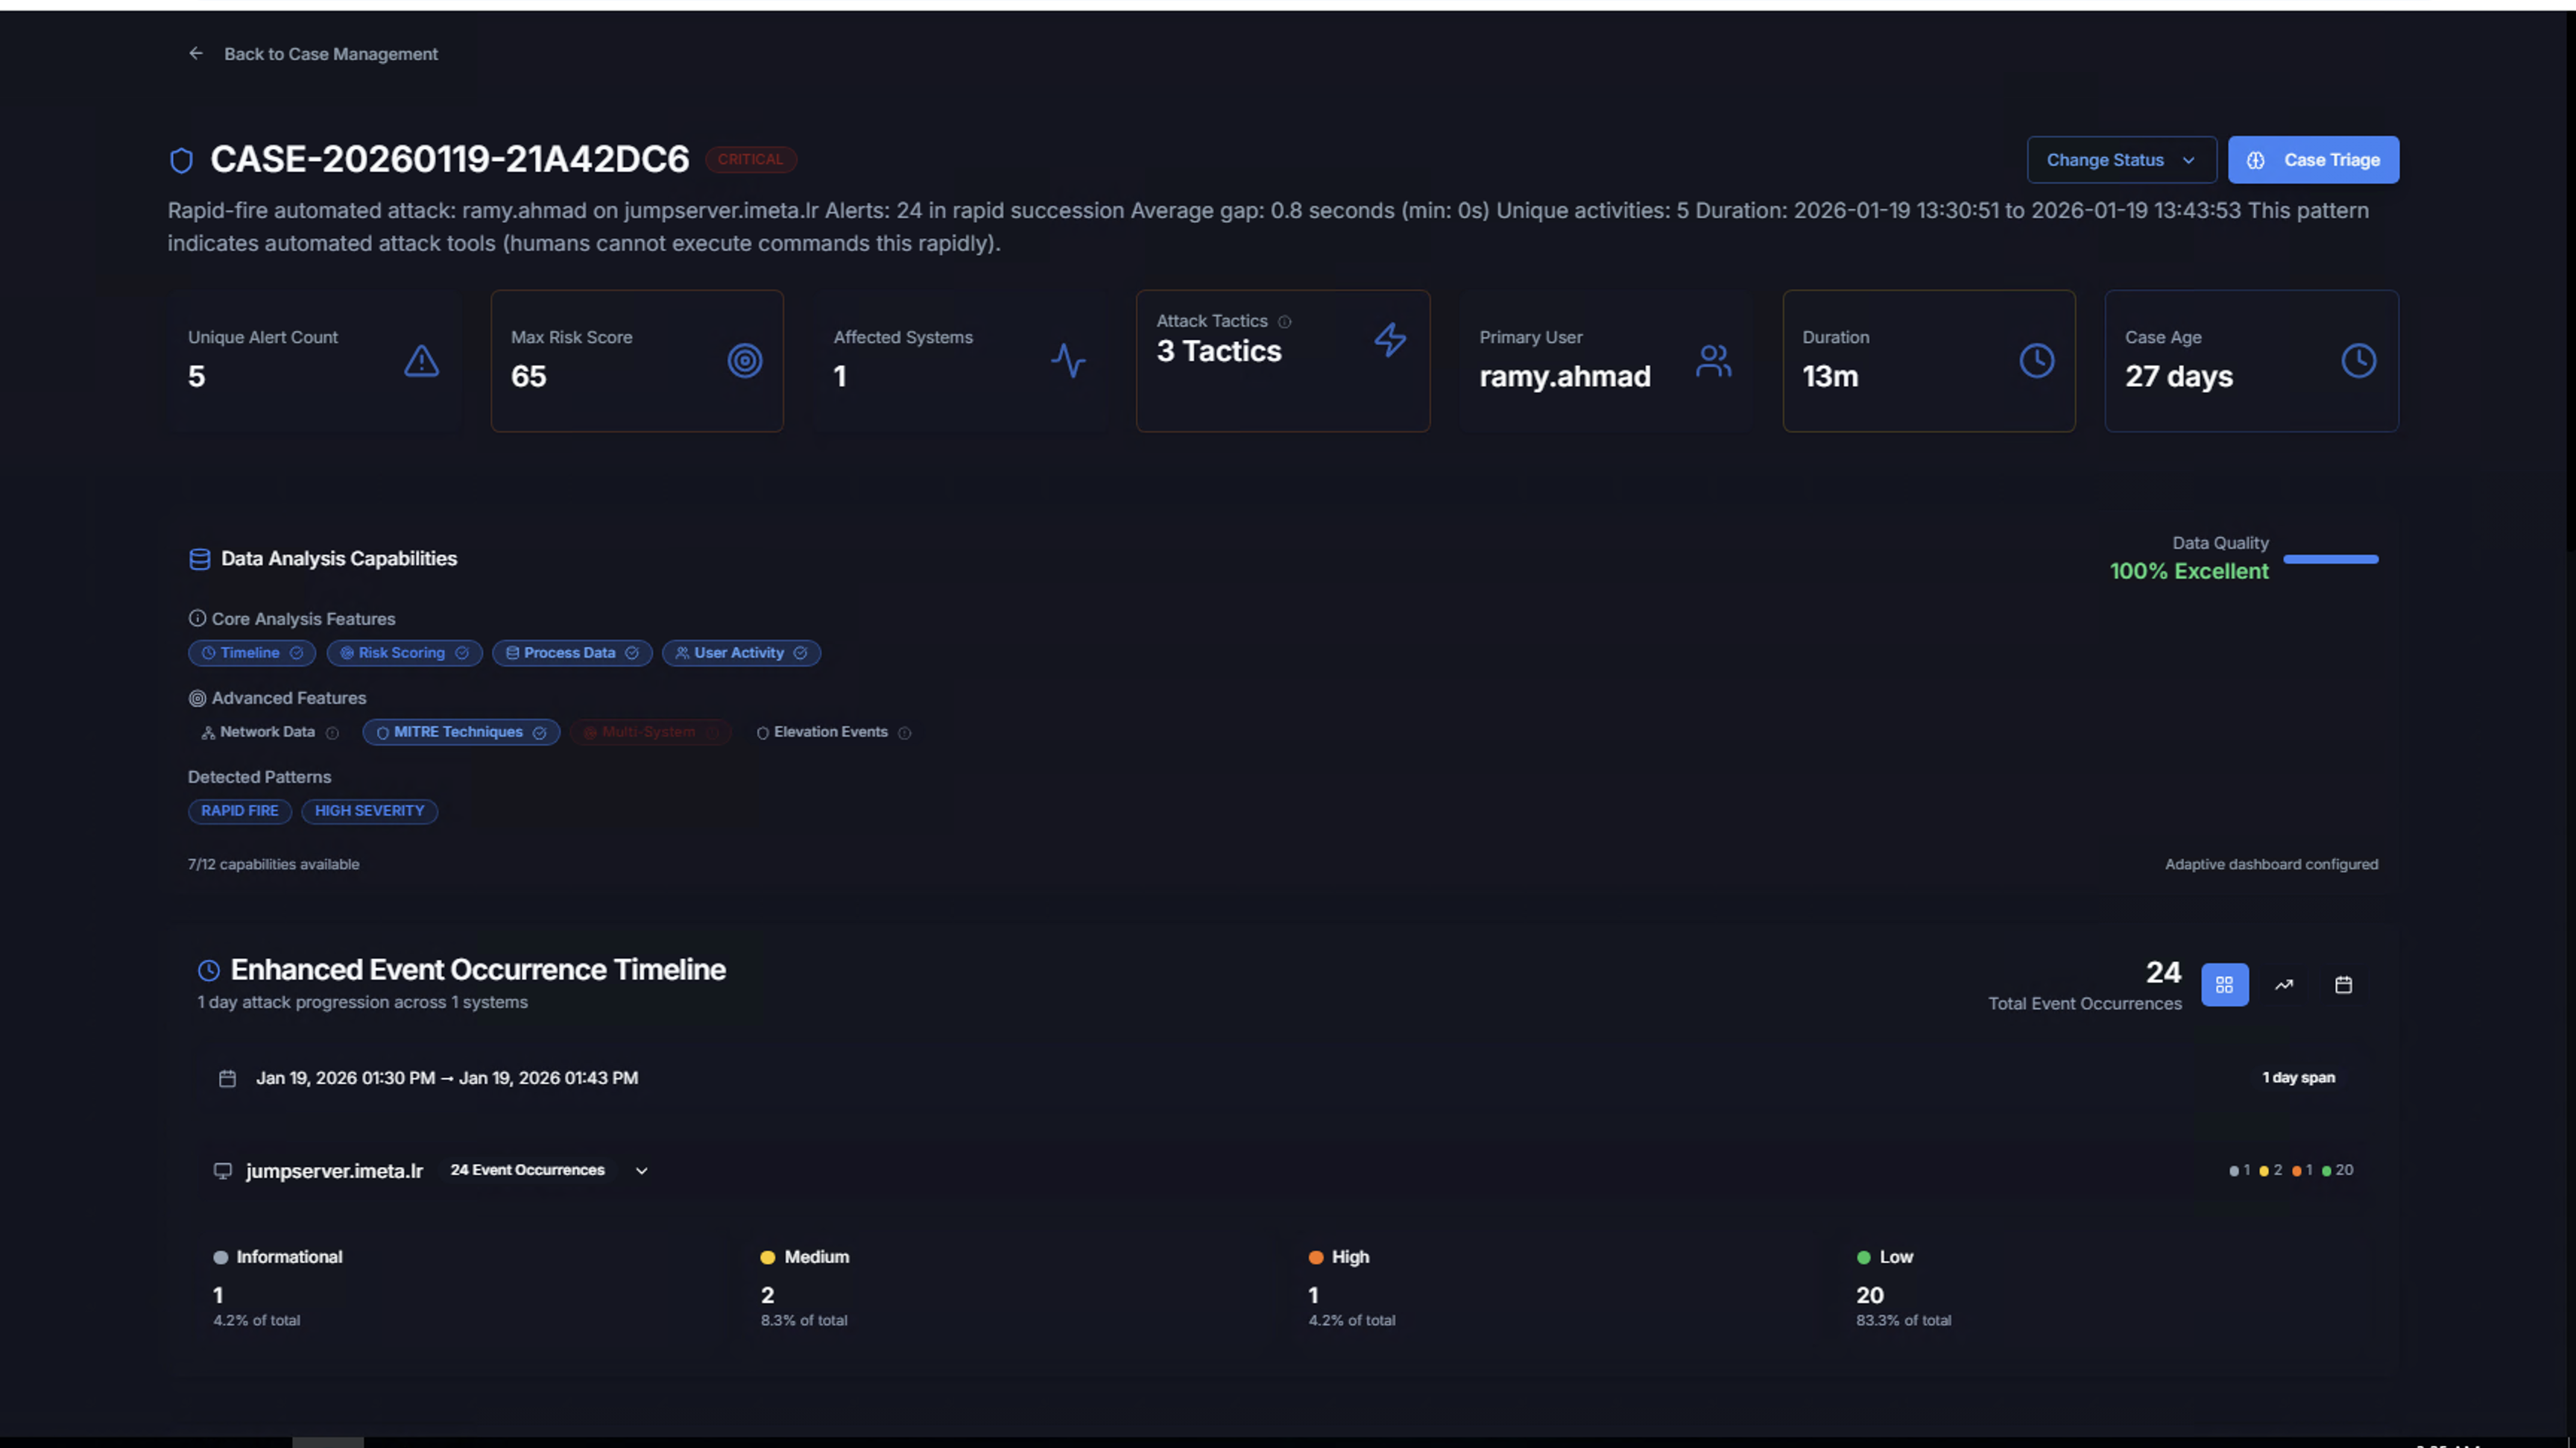
Click any case to open the full Case Management detail view.
RhythmX Timeline
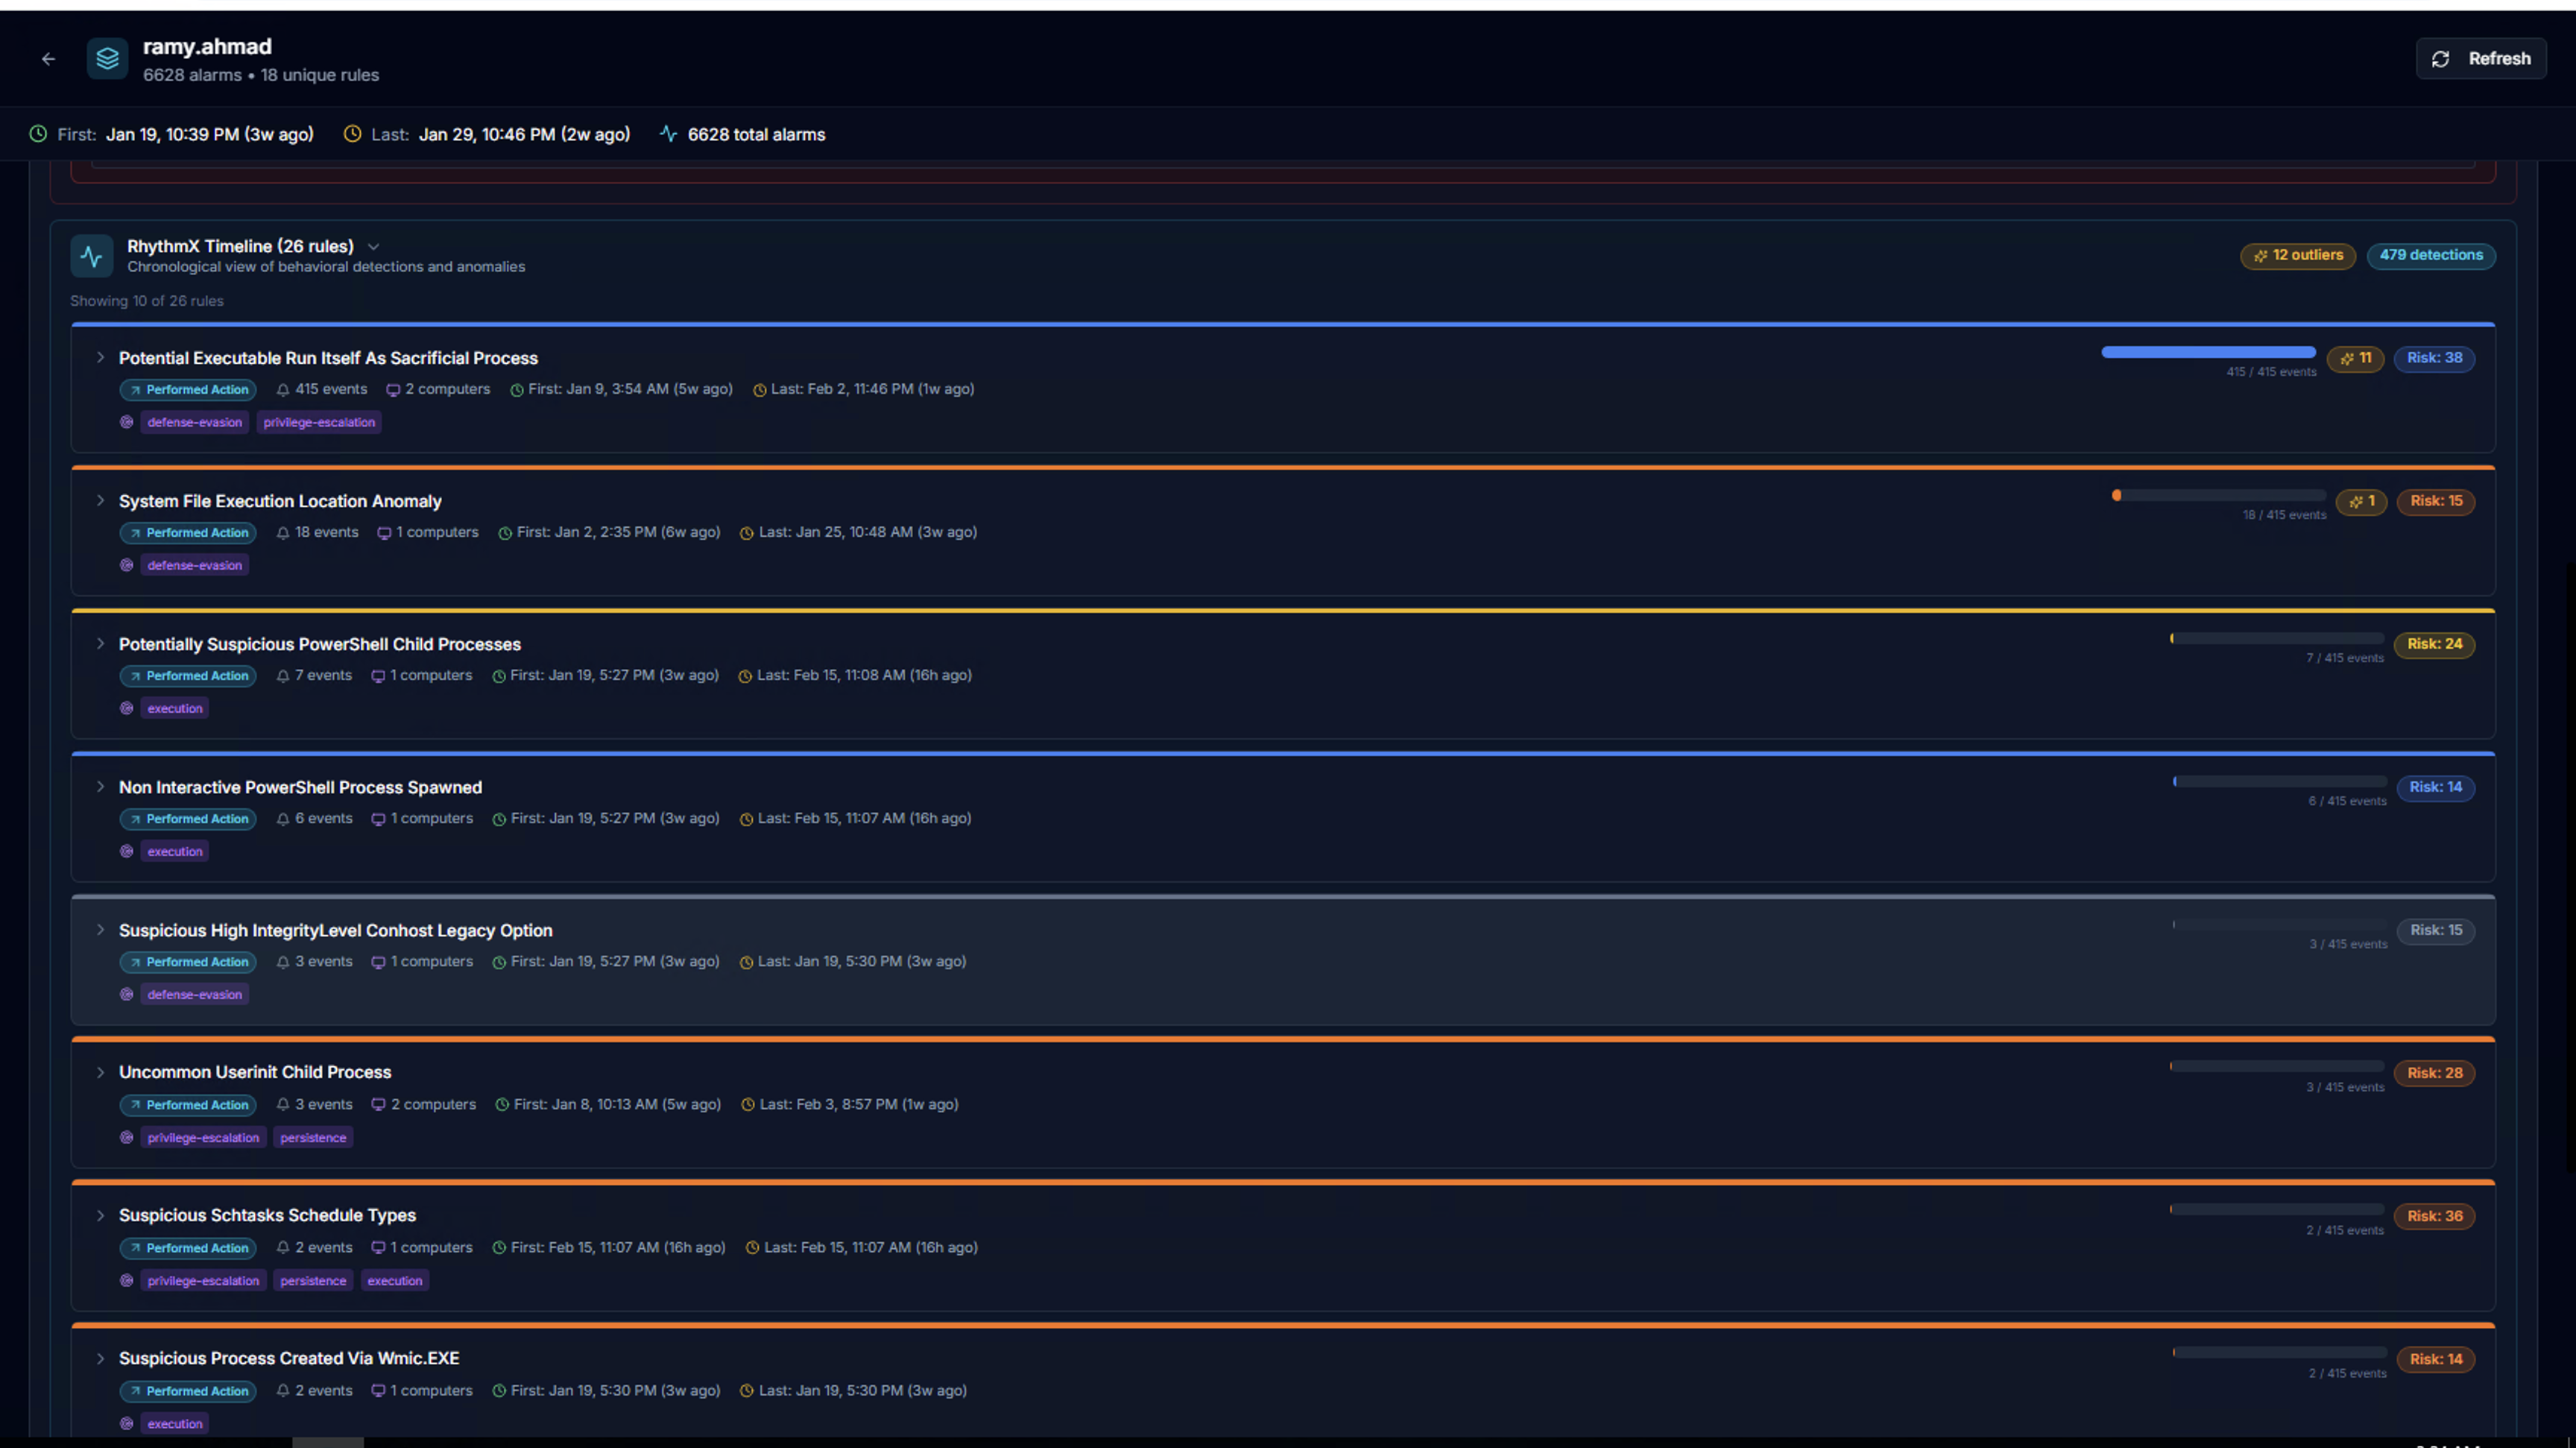
The RhythmX Timeline shows all behavioral detections chronologically. Each rule row displays:
| Element | Description |
|---|---|
| Rule name | Sigma detection rule that triggered |
| Performed Action badge | Indicates the alert type |
| Event count | Number of events matching this rule |
| Computers | Systems where the rule fired |
| First / Last seen | Time range of detections |
| Risk bar | Visual severity distribution |
| ML outlier count | Number of events flagged as anomalies by the ML engine |
| Risk score | Calculated risk for this rule |
| MITRE tactic tags | defense-evasion, privilege-escalation, persistence, execution, etc. |
LogRhythm Signals
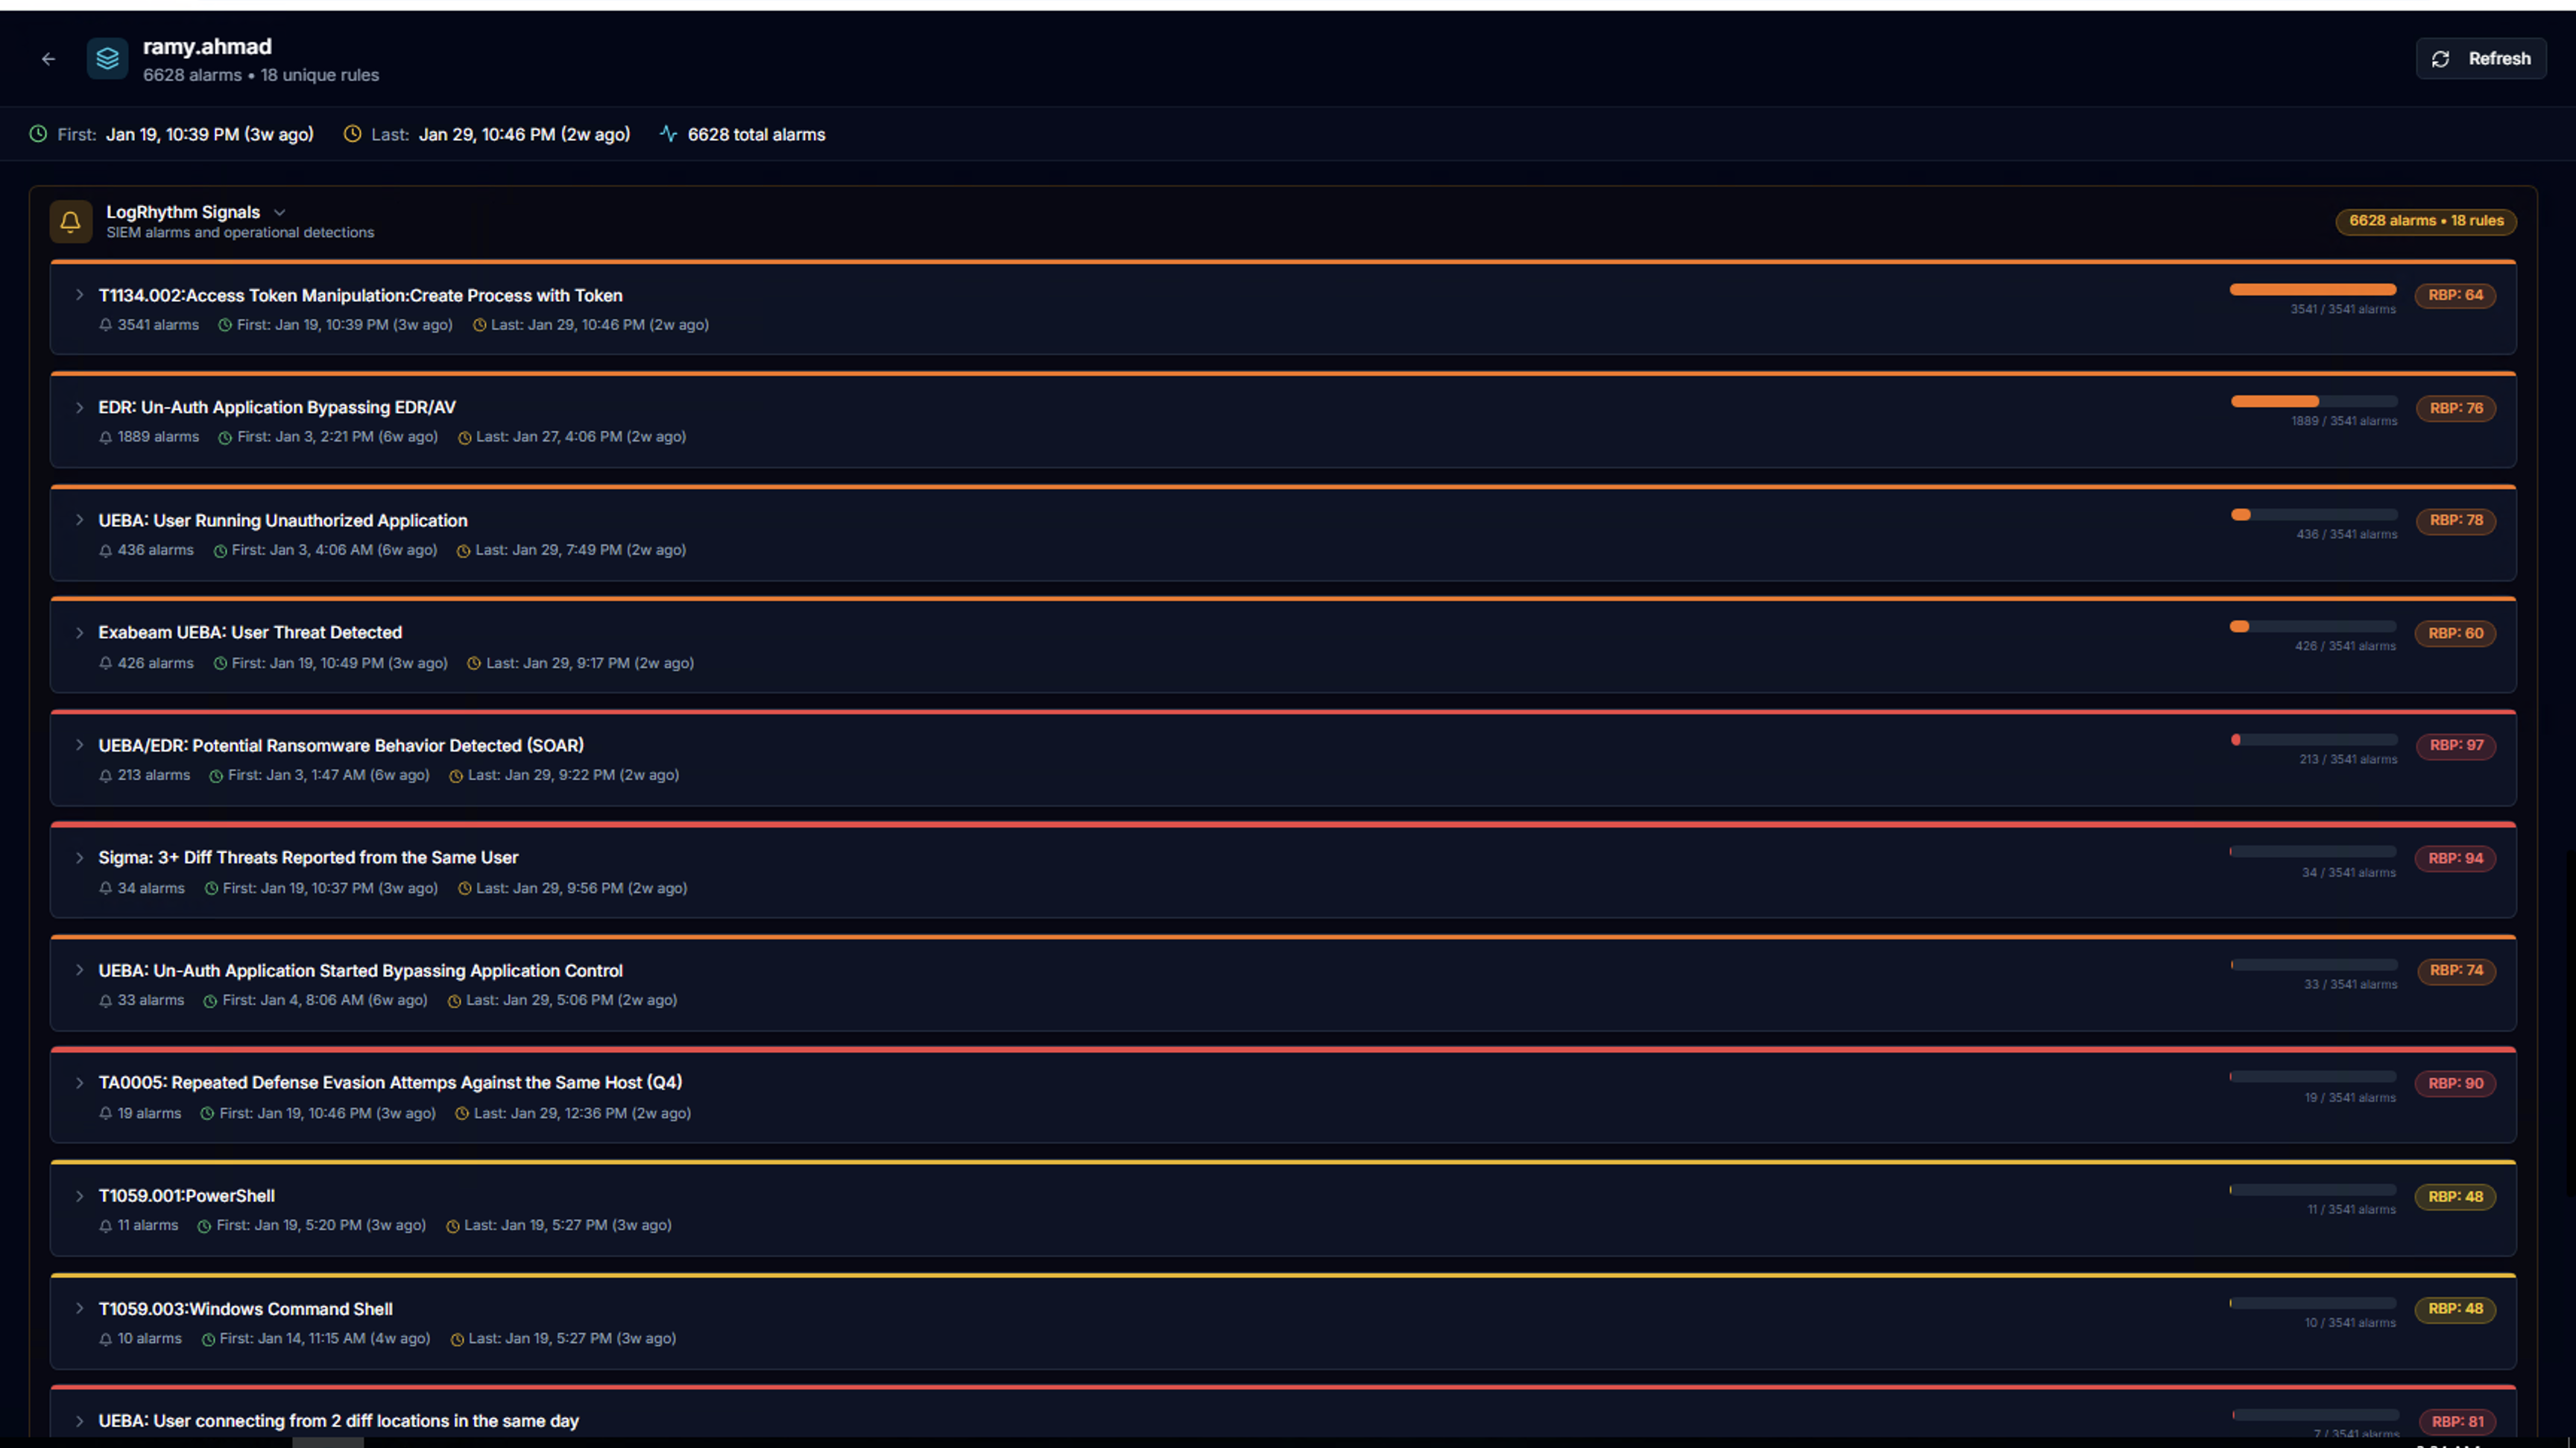
Expand LogRhythm Signals to see all SIEM alarm rules that fired for this actor. Each rule shows:
- Alarm rule title (e.g., TT04.002: Access Token Manipulation, UEBA: Potential Ransomware Behavior)
- Total alarm count
- First / Last seen timestamps
- Risk bar visualization
- RSP score (Risk Score Priority) — the LogRhythm-assigned risk rating
Alarm Instance Drill-Down
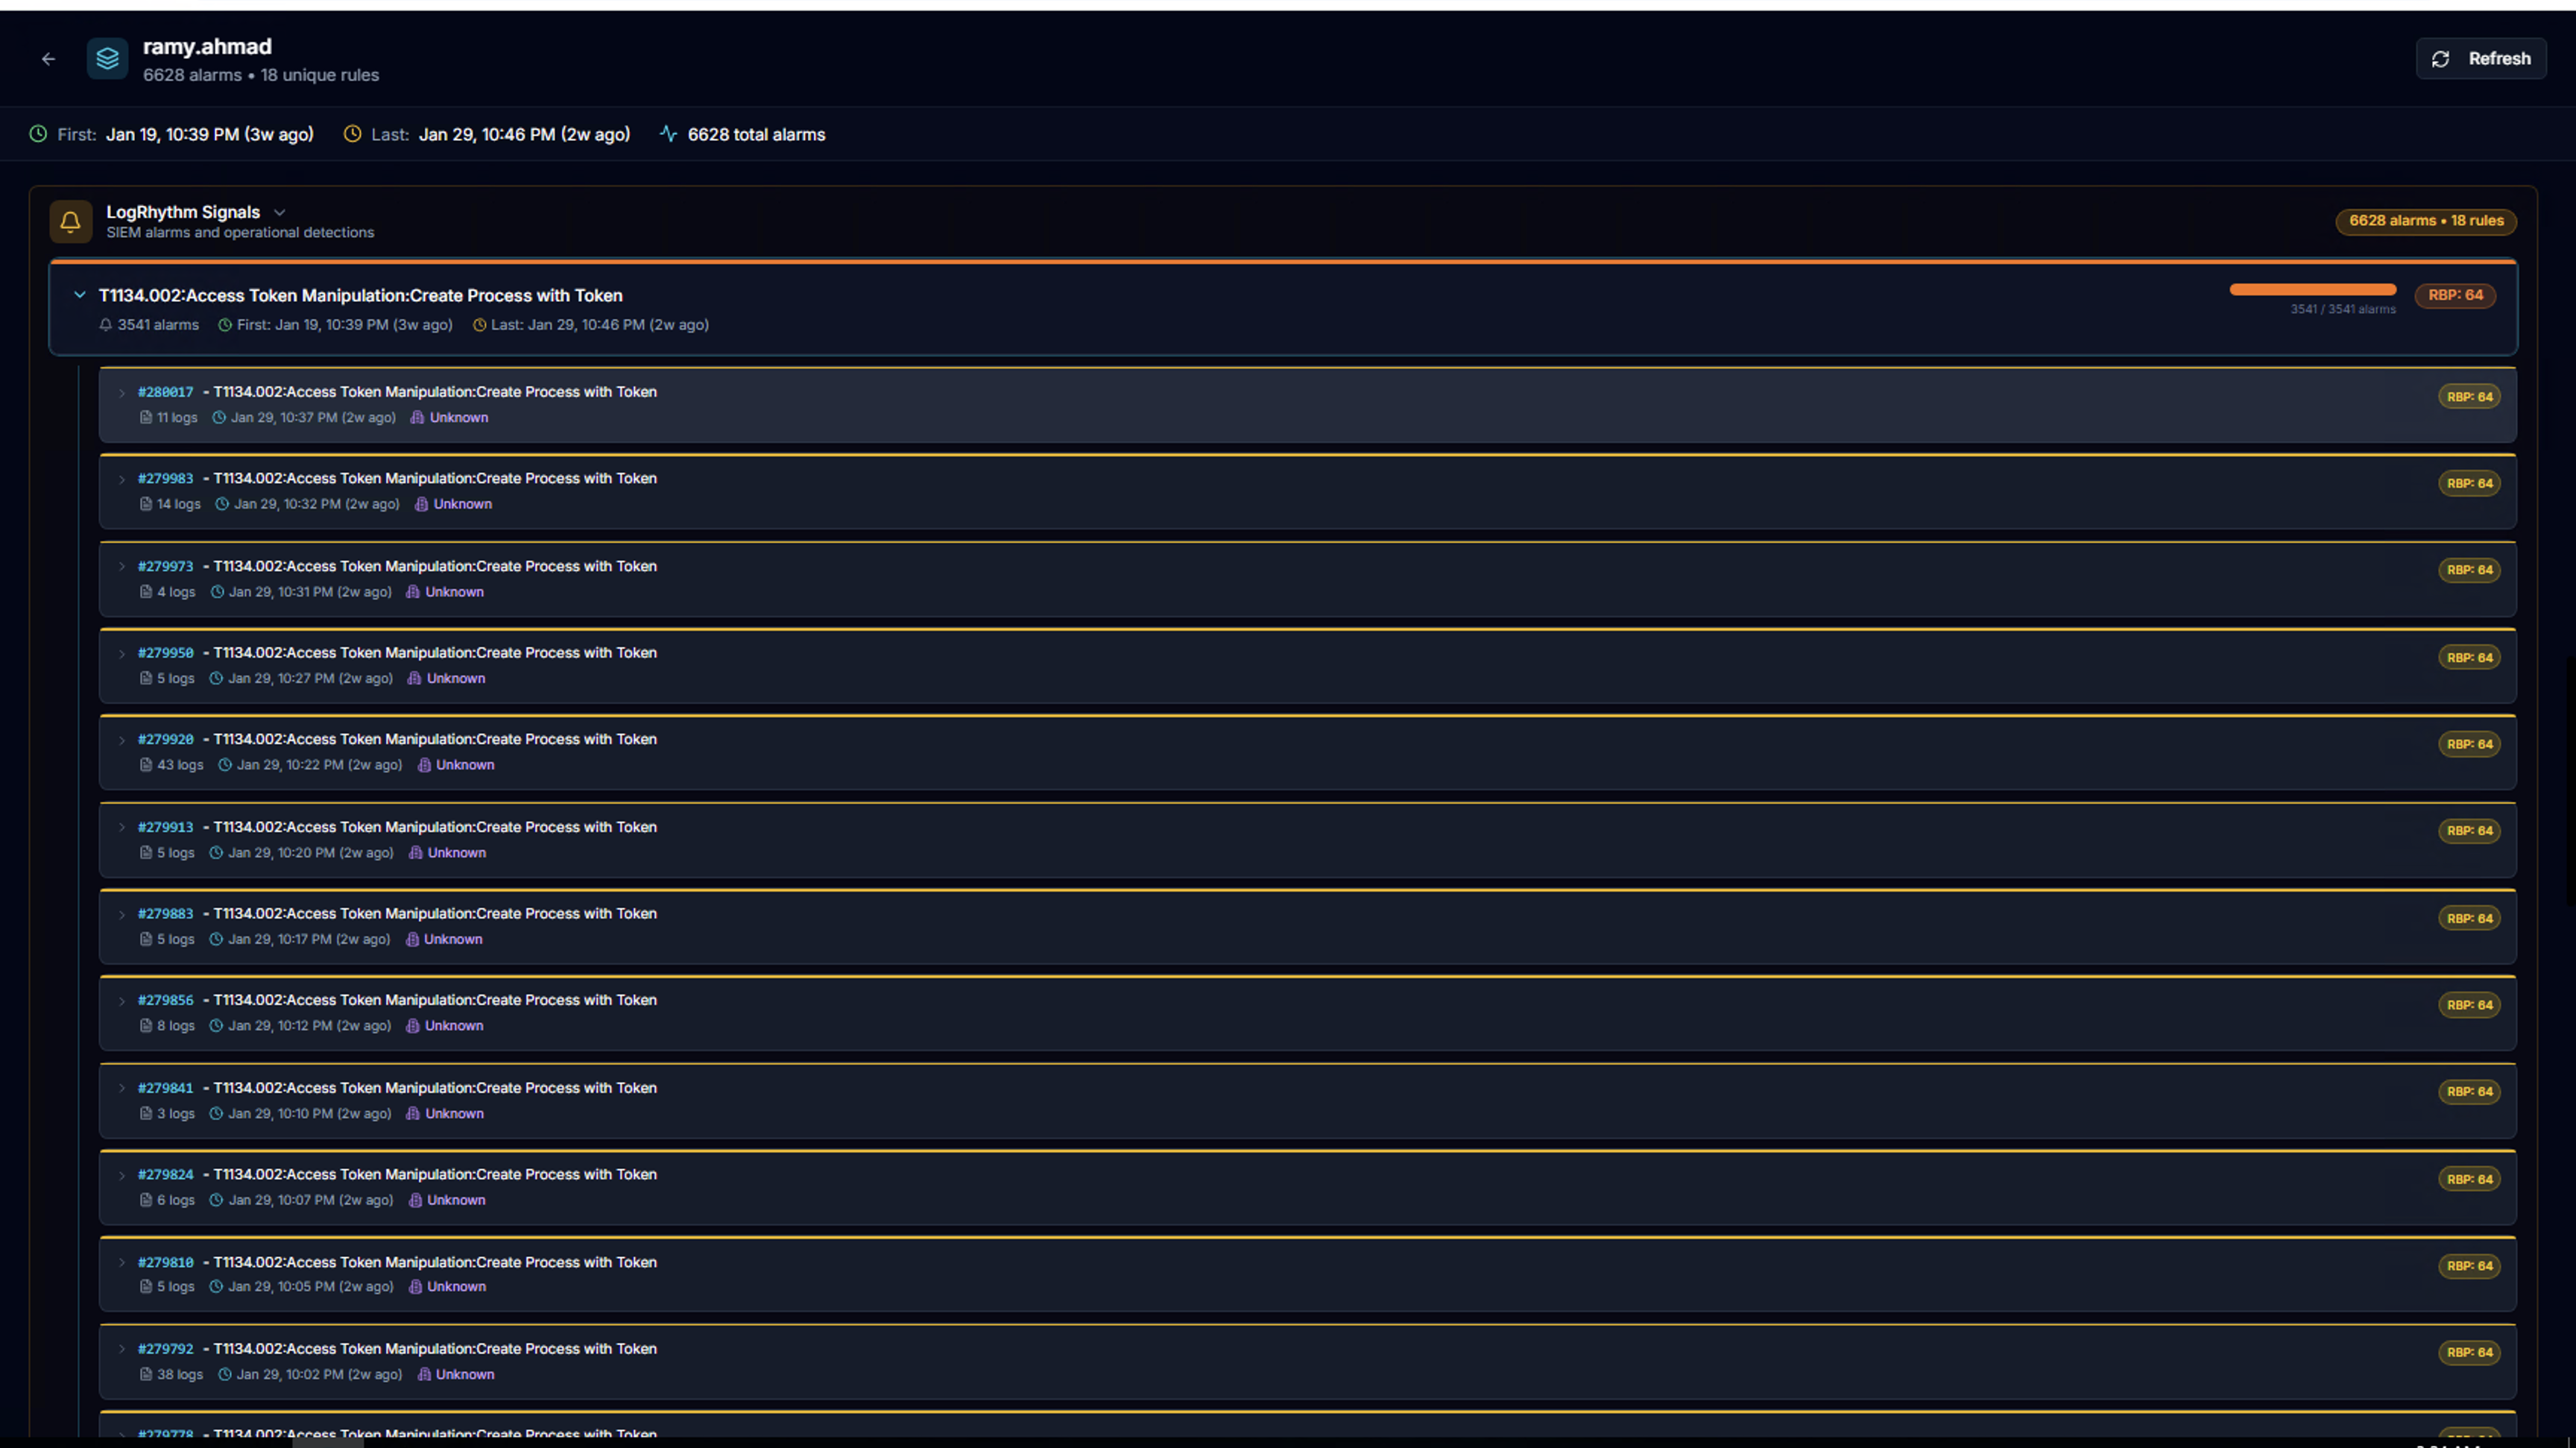
Click any alarm rule to expand the list of individual alarm instances. Each instance shows:
- Alarm ID
- Timestamp
- Log count
- Entity
- RSP score
Log Detail Table
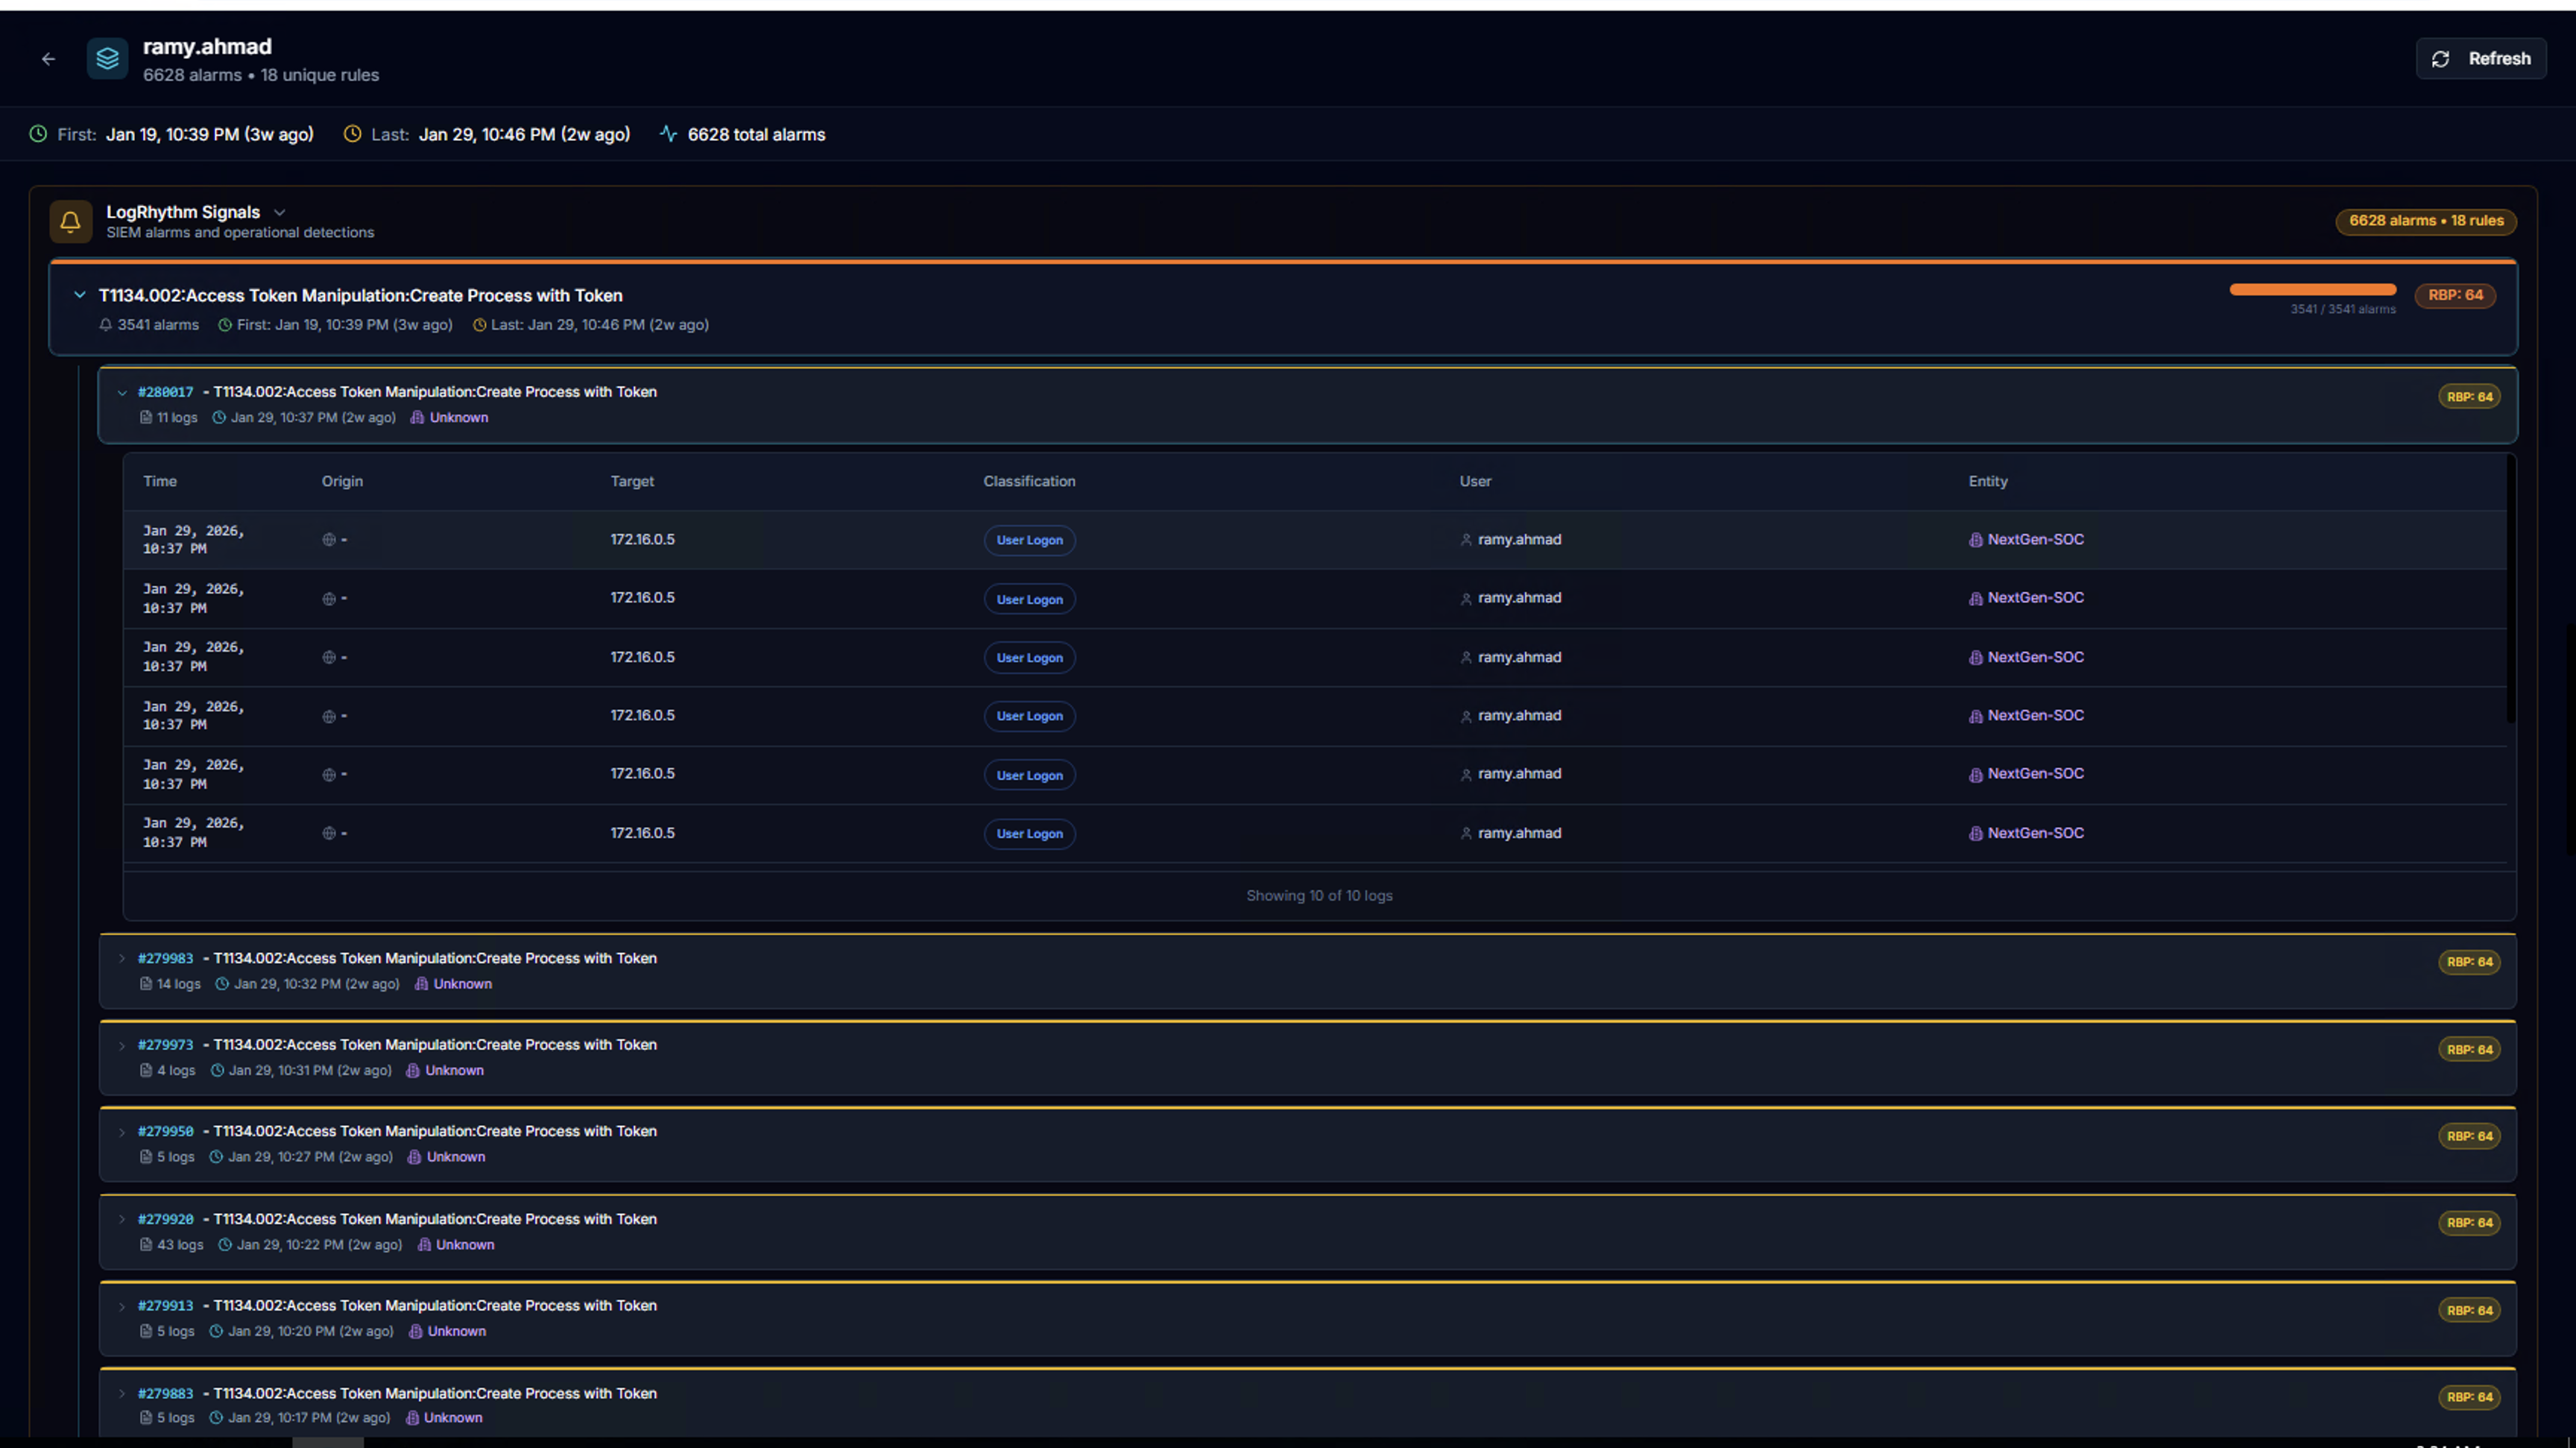
Expand any alarm instance to see the underlying log events in a table:
| Column | Description |
|---|---|
| Time | Event timestamp |
| Origin | Source system or IP |
| Target | Destination system or IP |
| Classification | Event type (e.g., User Login) |
| User | Associated user account |
| Entity | LogRhythm entity |
Event Details Panel
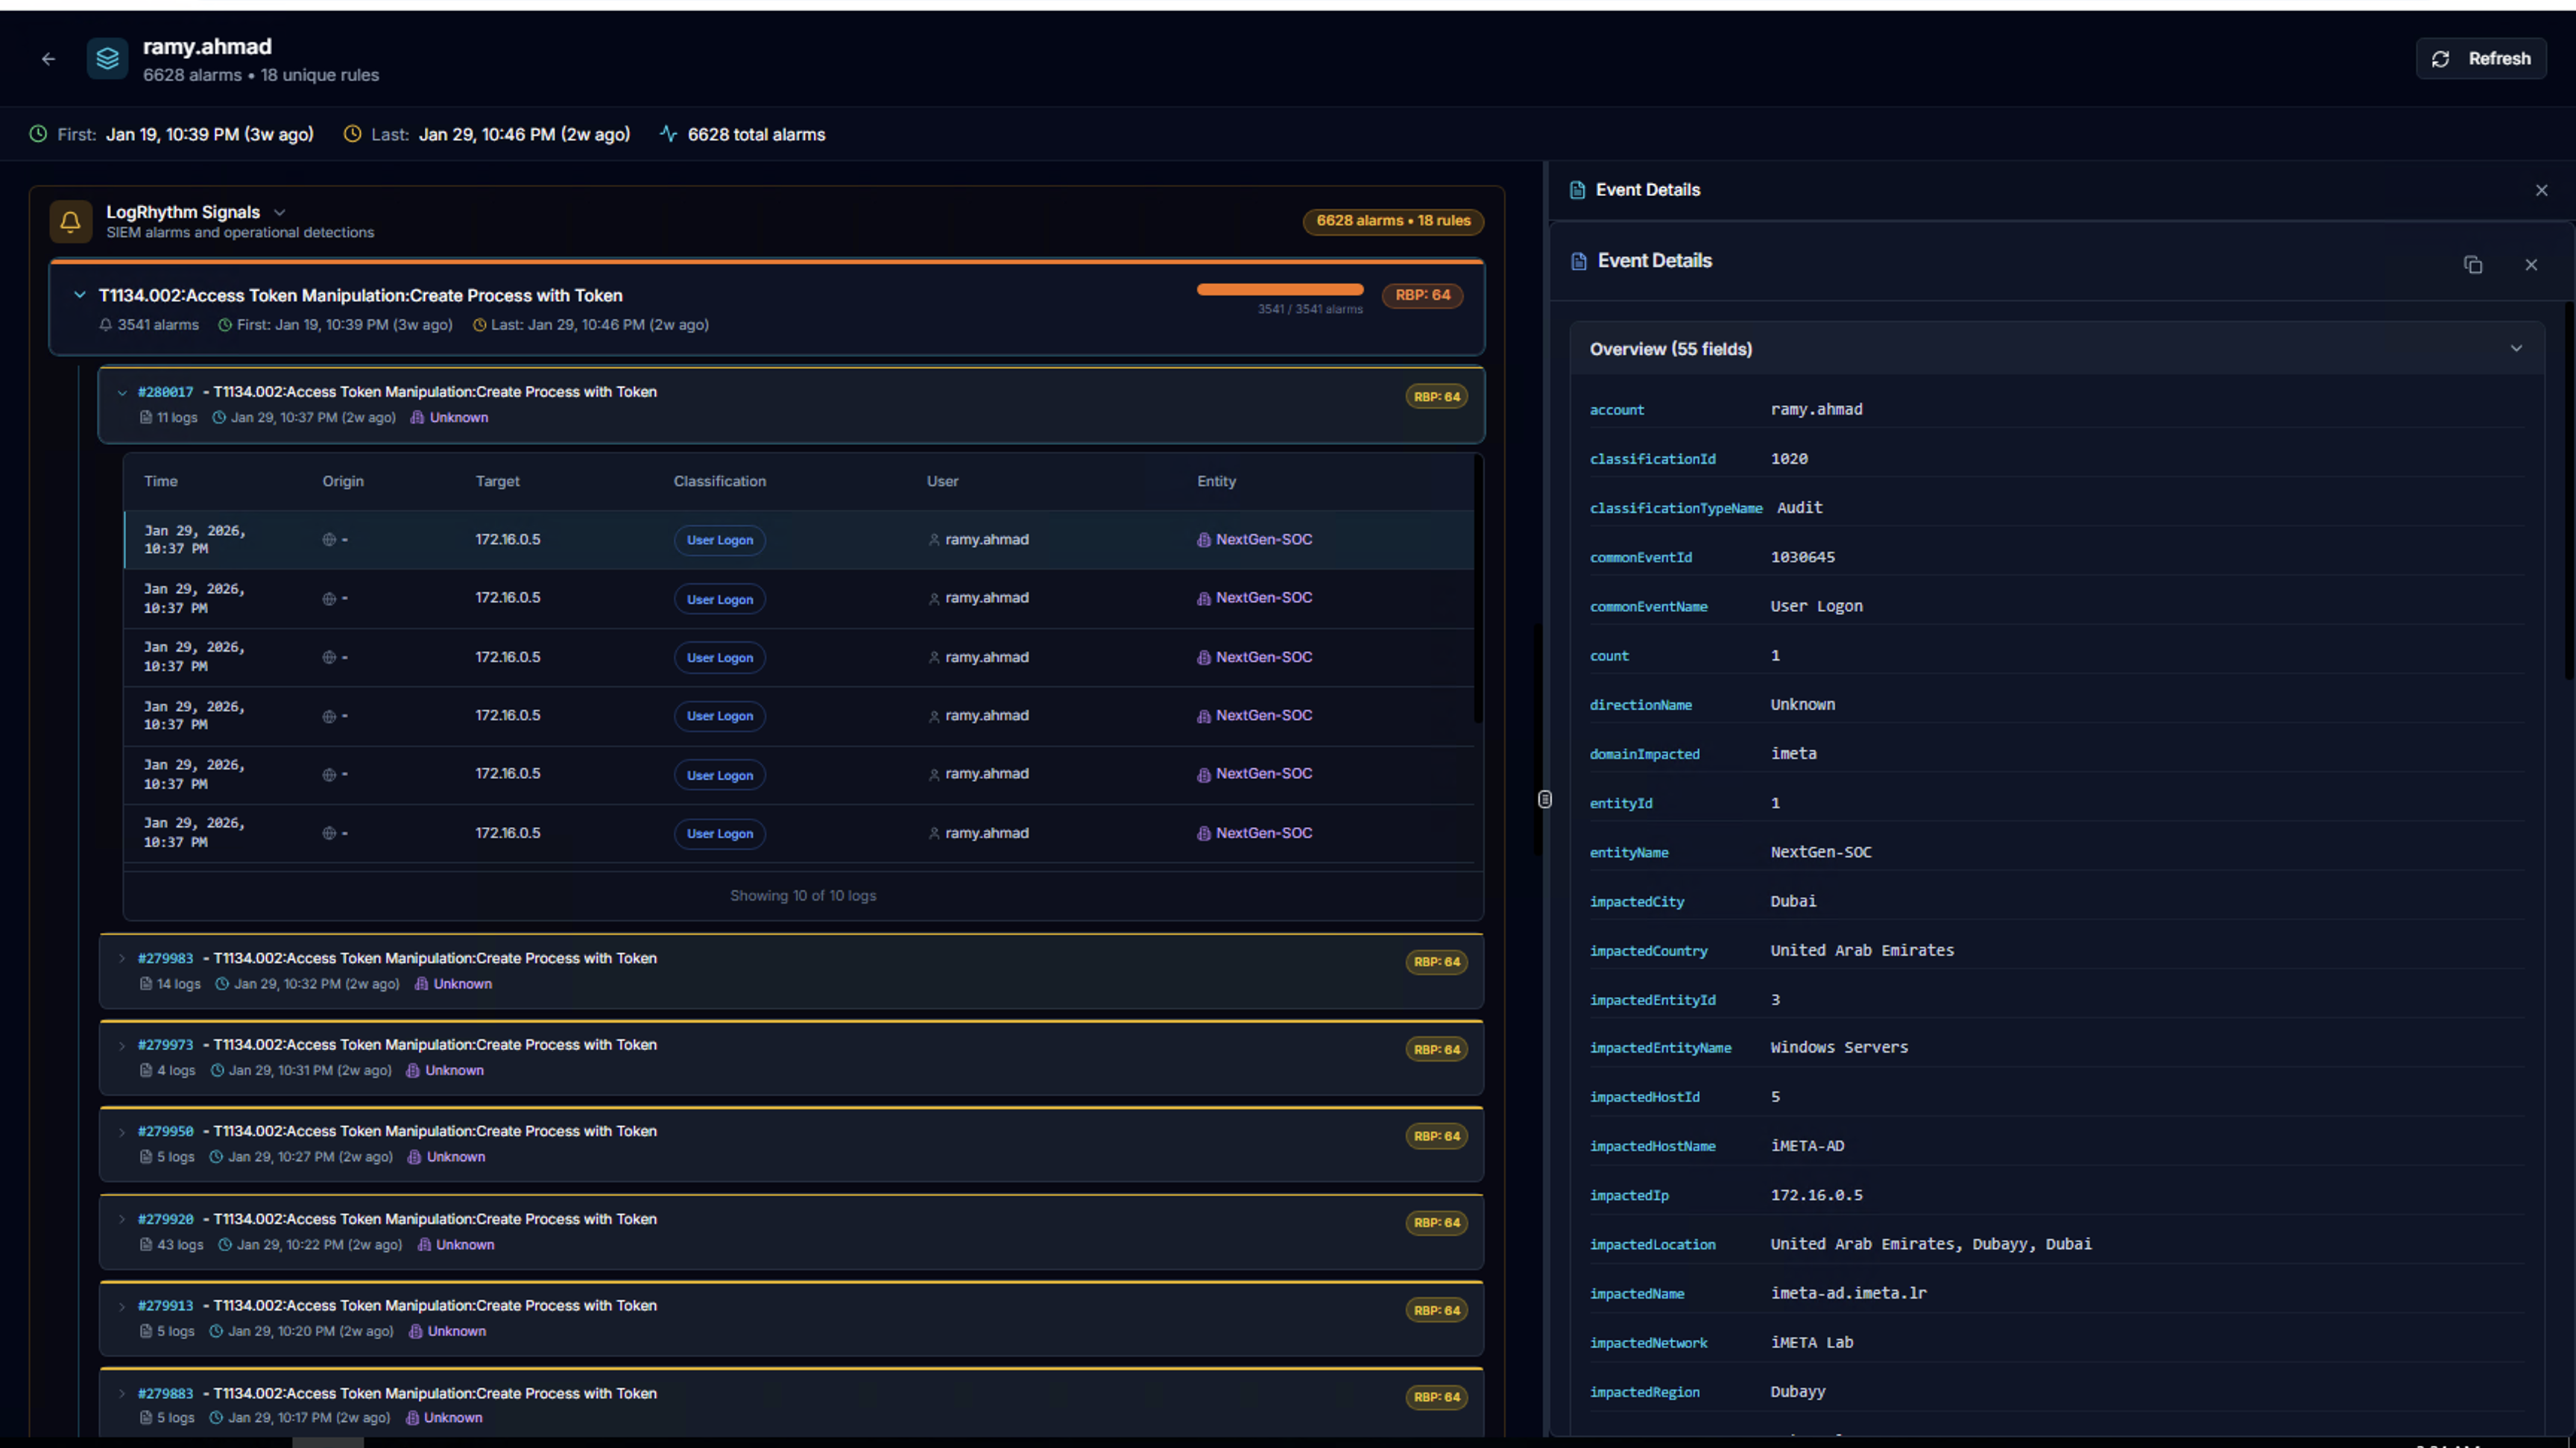
Click any log row to open the Event Details panel on the right side, showing all fields for the selected event as key-value pairs.
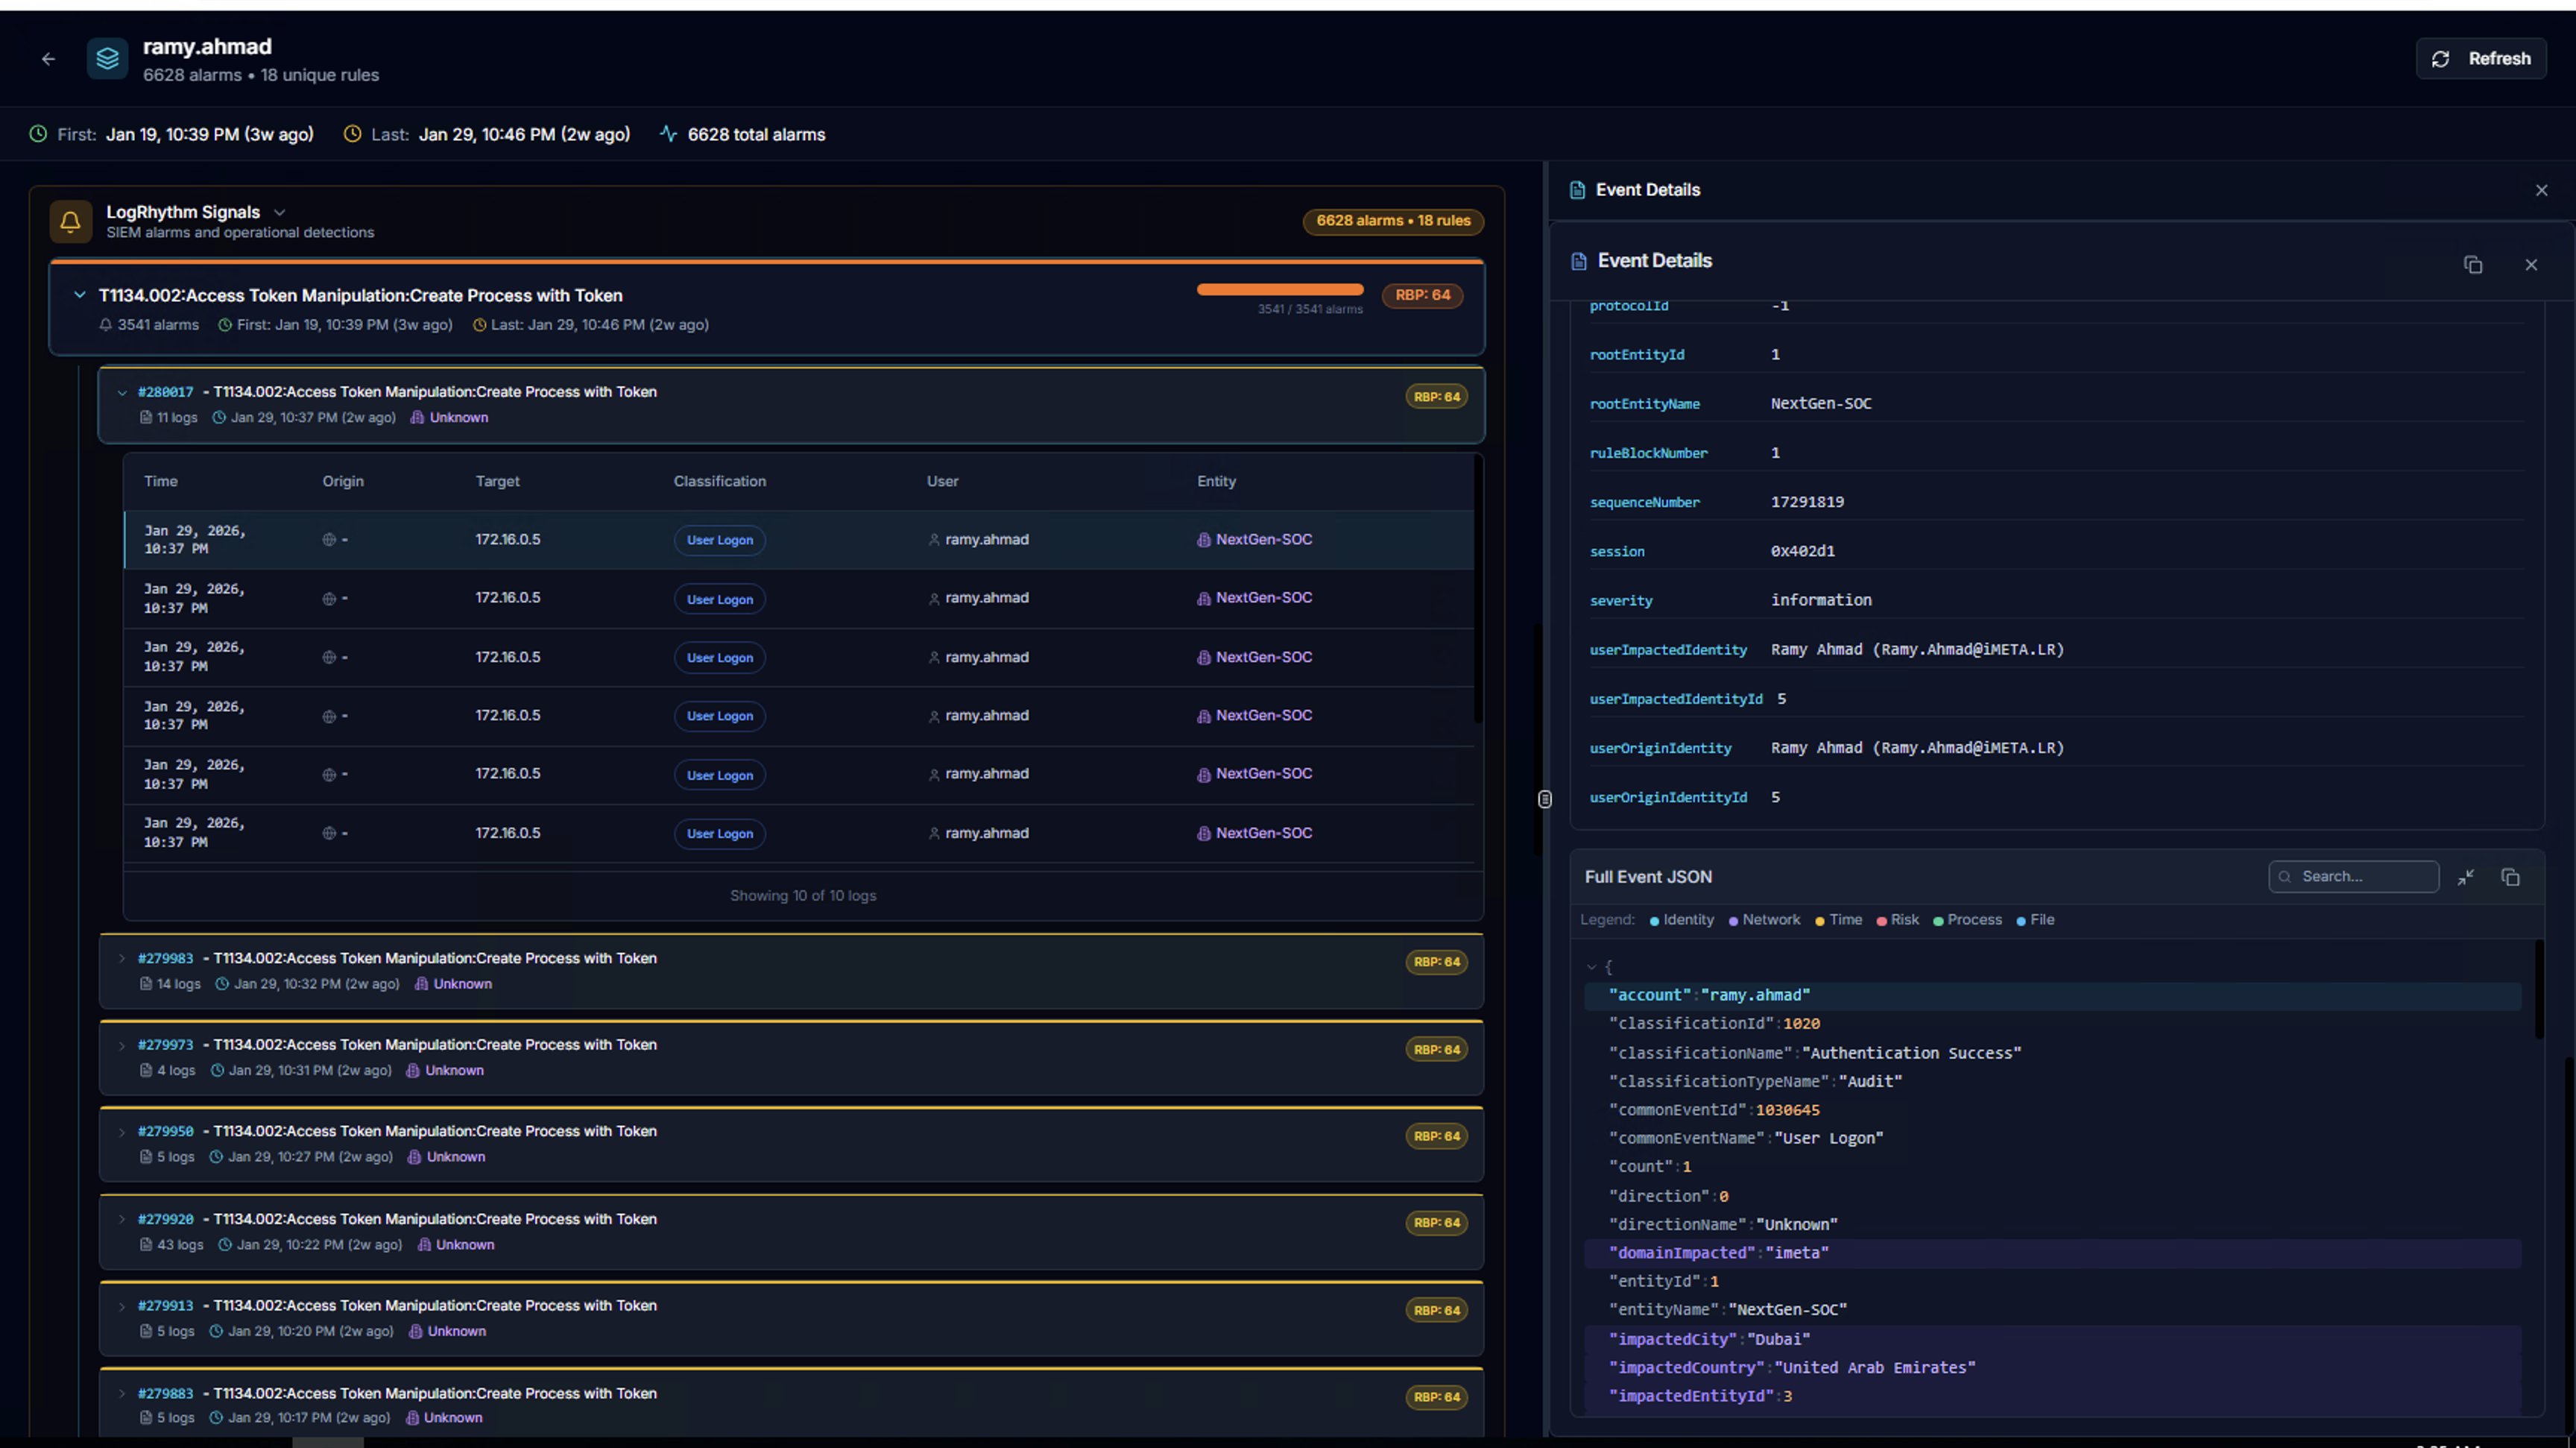
Scroll down to see the Full Event JSON — the complete raw event data with search, copy, and expand controls.
Risk Score Calculation
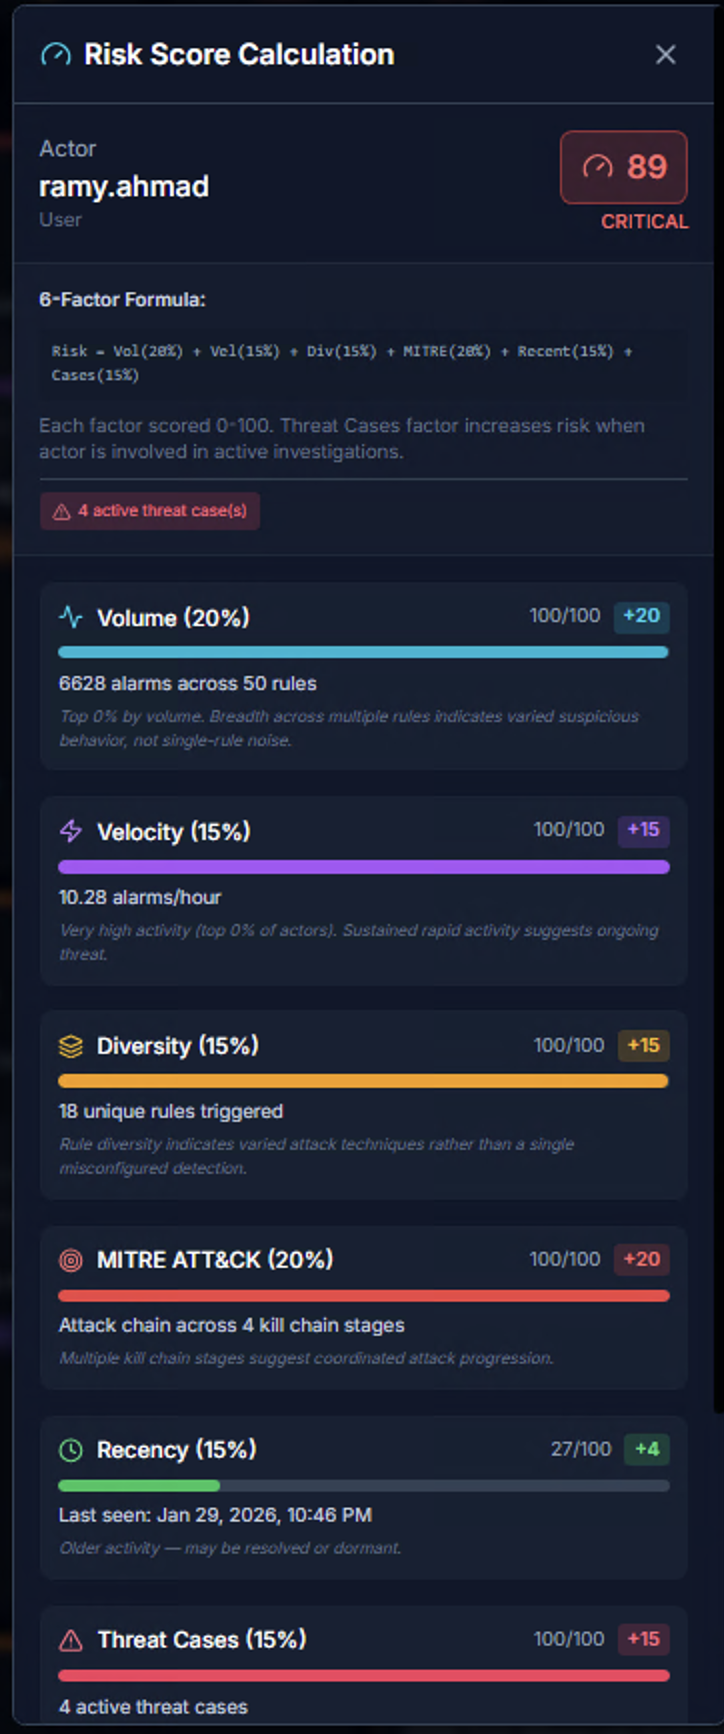
Click the risk score badge on any actor to see the full Risk Score Calculation breakdown. The score is a 0–100 integer computed using a 6-factor model:
| Factor | Weight | What It Measures | Scoring |
|---|---|---|---|
| Volume | 20% | Total alarm count across all rules | More alarms across more rules = higher score |
| Velocity | 15% | Alarms per hour — burst rate | Sustained rapid activity indicates automation or active attack |
| Diversity | 15% | Number of unique rules triggered | High diversity indicates varied attack techniques, not single-rule noise |
| MITRE ATT&CK | 20% | Kill chain stage coverage | Multiple tactics across the kill chain suggest coordinated/sophisticated attacks |
| Recency | 15% | Time since last alarm | Recent activity scores higher than stale alerts |
| Threat Cases | 15% | Active correlation cases involving this actor | Active cases from the RhythmX Analytics engine increase risk |
Each factor is scored 0–100 independently, then weighted to produce the final composite score.
Risk Tiers:
| Score | Level | Color |
|---|---|---|
| 76–100 | Critical | Red |
| 51–75 | High | Orange |
| 26–50 | Medium | Yellow |
| 0–25 | Low | Green |
Rule Analytics
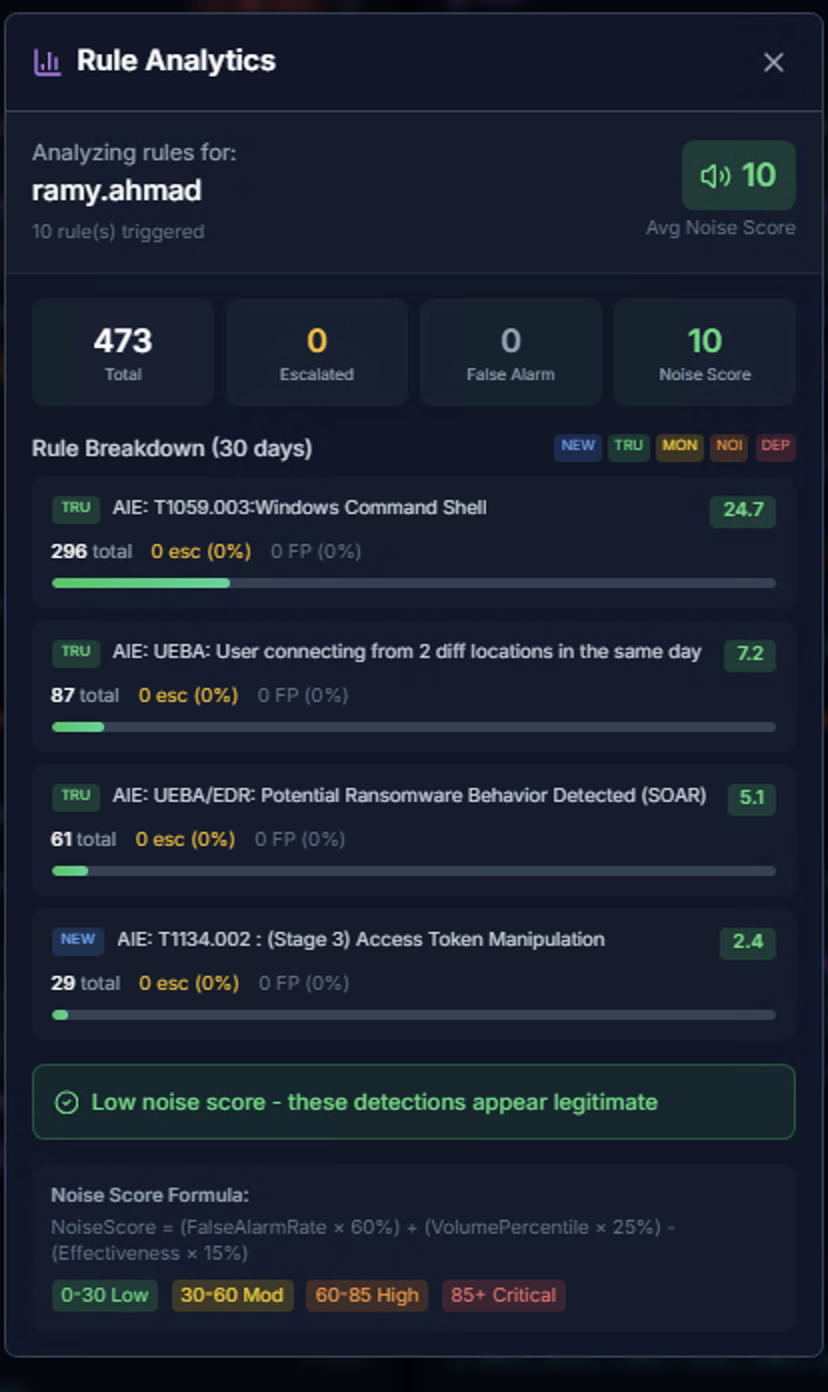
The Rule Analytics modal analyzes detection quality for an actor:
| Metric | Description |
|---|---|
| Total | Total alarms analyzed |
| Escalated | Alarms that were escalated |
| False Alarm | Alarms marked as false positives |
| Noise Score | Aggregate noise rating (0–100) |
Rule Breakdown shows the top firing rules with their percentage of total volume.
Noise Score is a composite metric (0–100) that factors in false alarm rate, alert volume, and rule effectiveness to identify rules that need tuning.
| Range | Classification |
|---|---|
| 0–30 | Low noise — detections appear legitimate |
| 30–60 | Medium noise |
| 60–80 | High noise |
| 81+ | Critical noise — likely needs tuning |
SLA Tracking
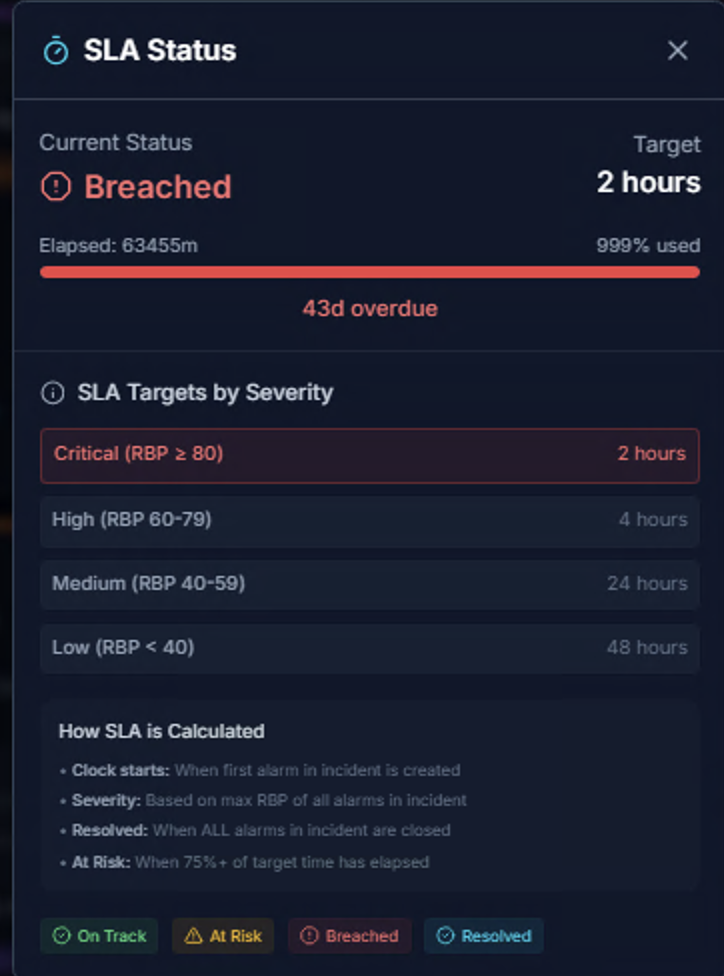
The SLA Status modal tracks response time targets for each incident:
| Field | Description |
|---|---|
| Current Status | On Track, At Risk, Breached, or Resolved |
| Target | SLA target time based on severity |
| Elapsed | Time since incident creation |
| % Used | Percentage of SLA time consumed |
SLA Targets by Severity:
| Severity | RBP Range | Target |
|---|---|---|
| Critical | RBP >= 80 | 2 hours |
| High | RBP 60–79 | 4 hours |
| Medium | RBP 40–59 | 24 hours |
| Low | RBP < 40 | 48 hours |
How SLA is Calculated:
- Clock starts — When the first alarm in the incident is created
- Severity — Based on the maximum RBP (Risk Based Priority) of all alarms in the incident
- Resolved — When ALL alarms in the incident are closed
- At Risk — When 75%+ of the target time has elapsed
Analytics View
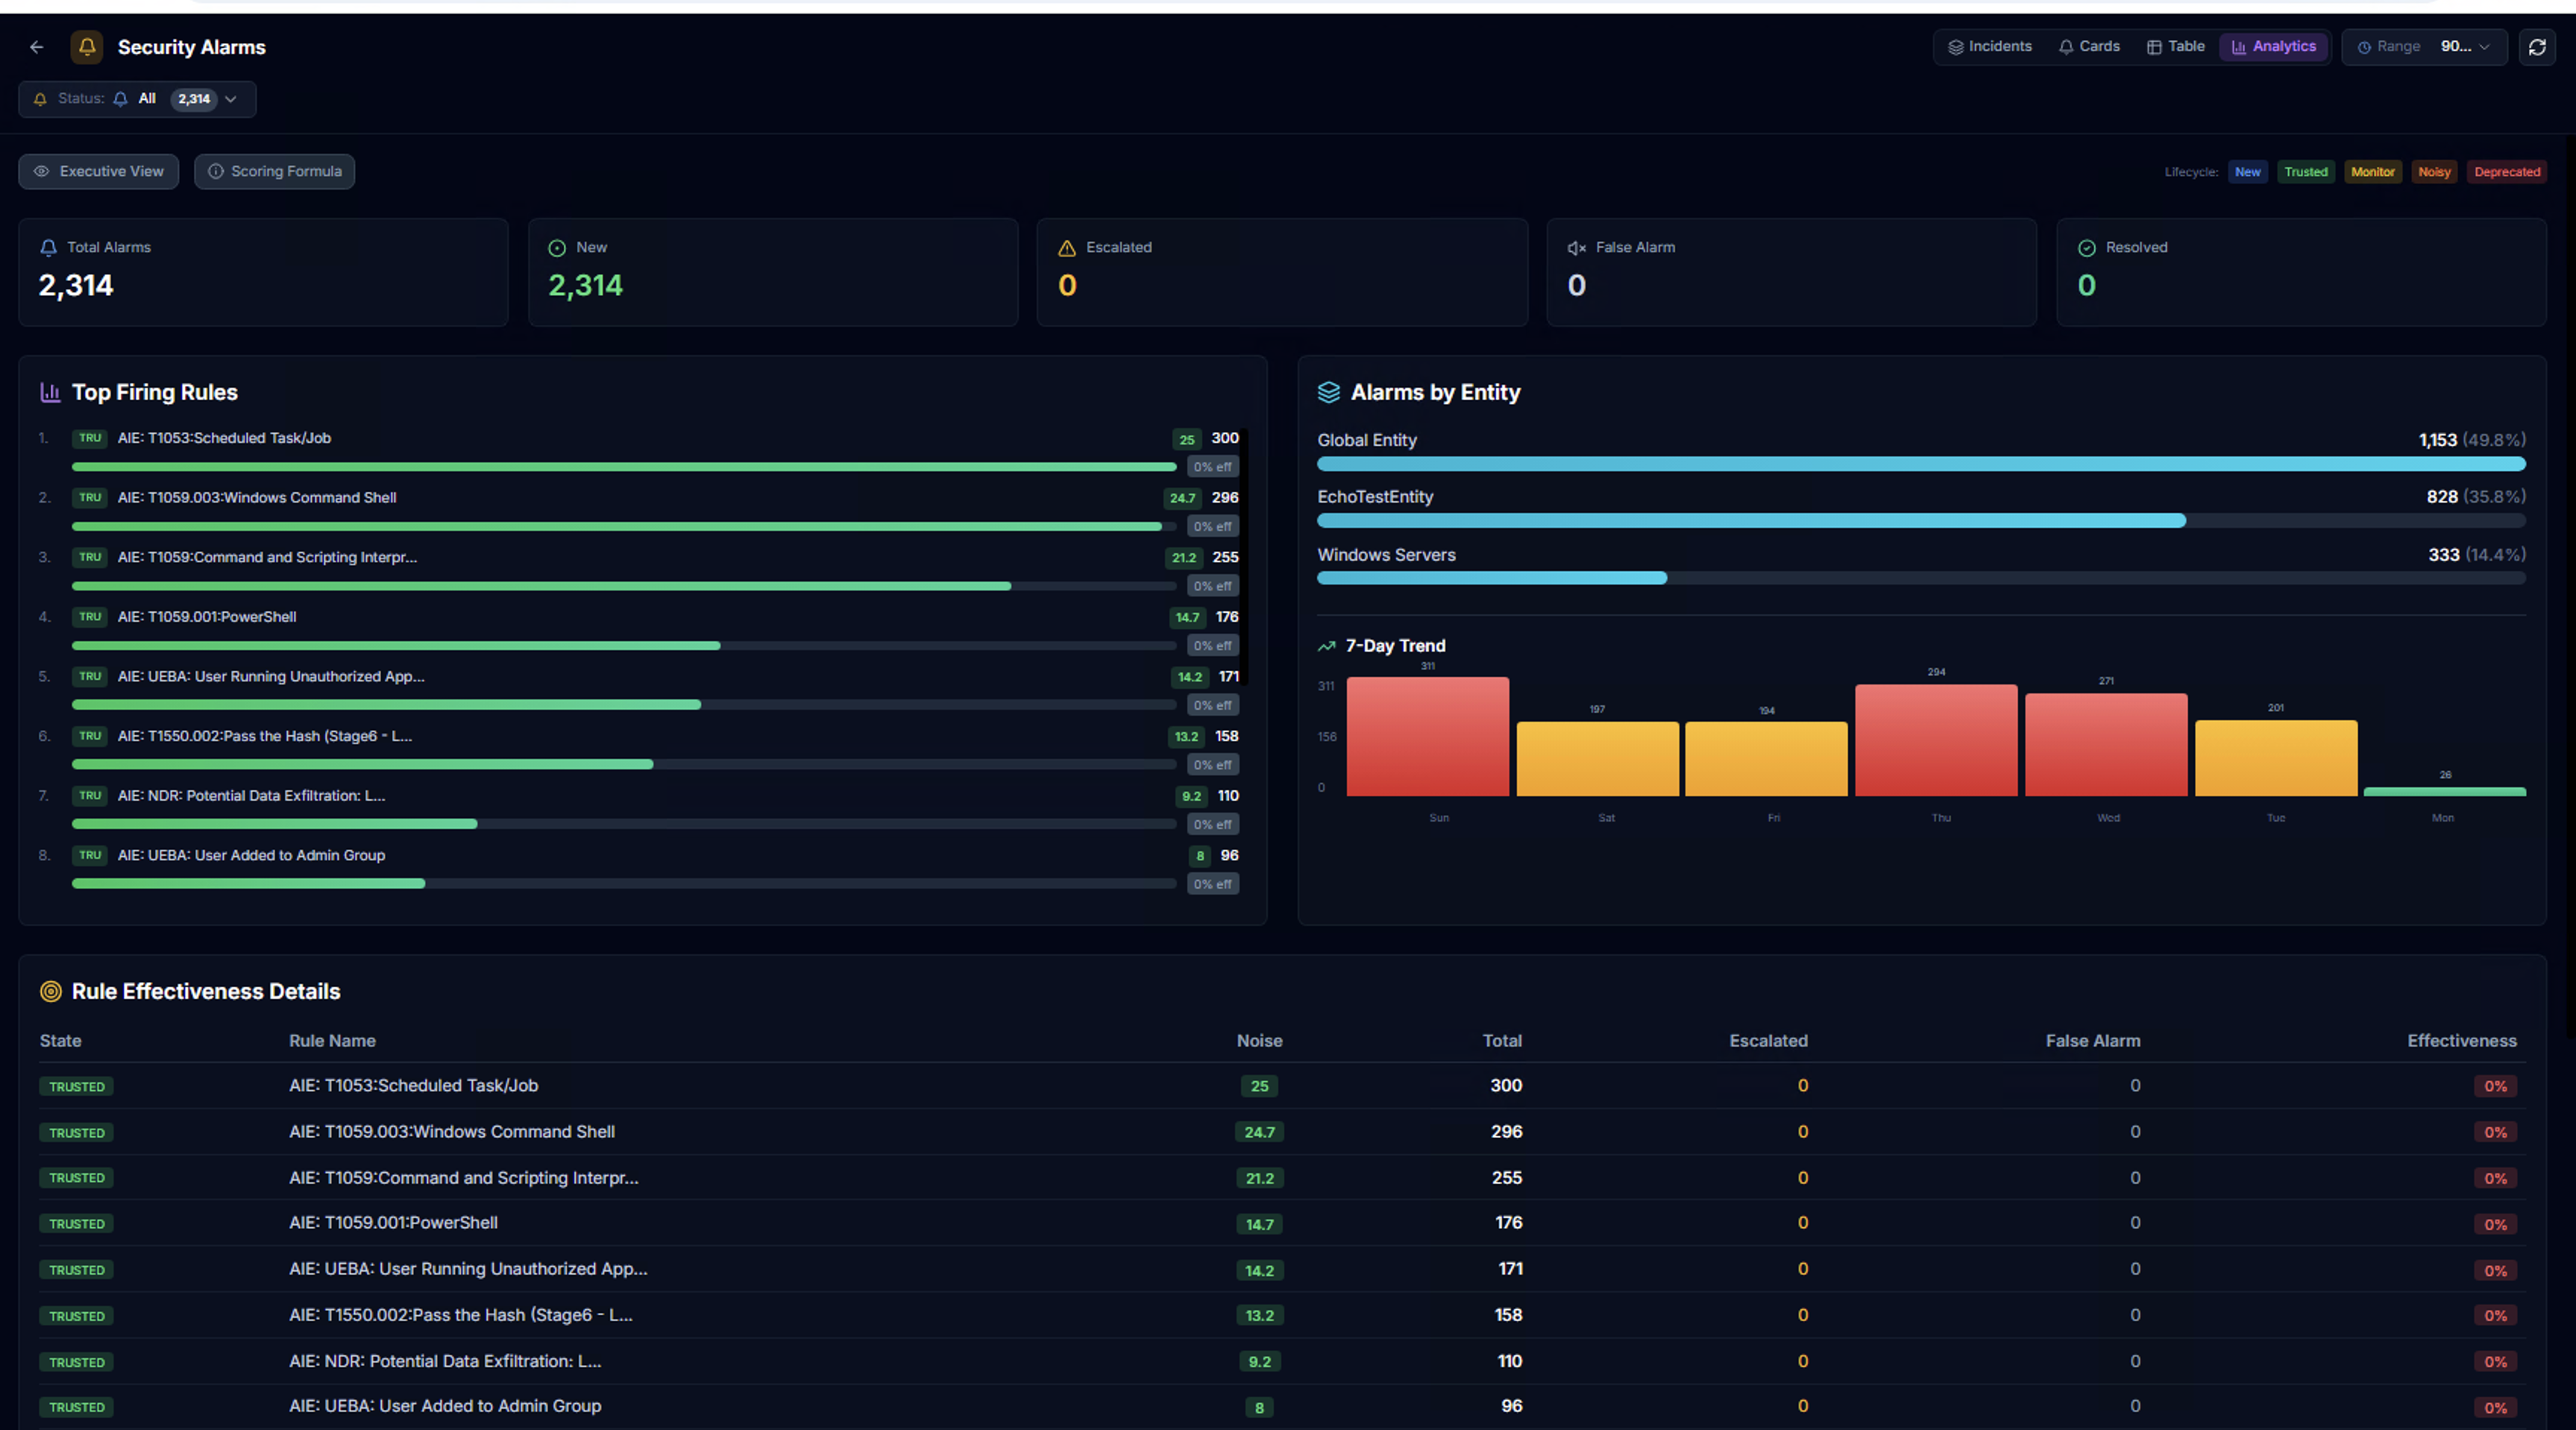
The Analytics tab provides aggregate analysis of alarm data:
- KPIs — Total alarms, new, escalated, false alarm, resolved counts
- Top Firing Rules — Horizontal bar chart of the most active alarm rules
- Alarms by Entity — Distribution across LogRhythm entities with percentages
- 7-Day Trend — Daily alarm volume bar chart
Rule Effectiveness Details
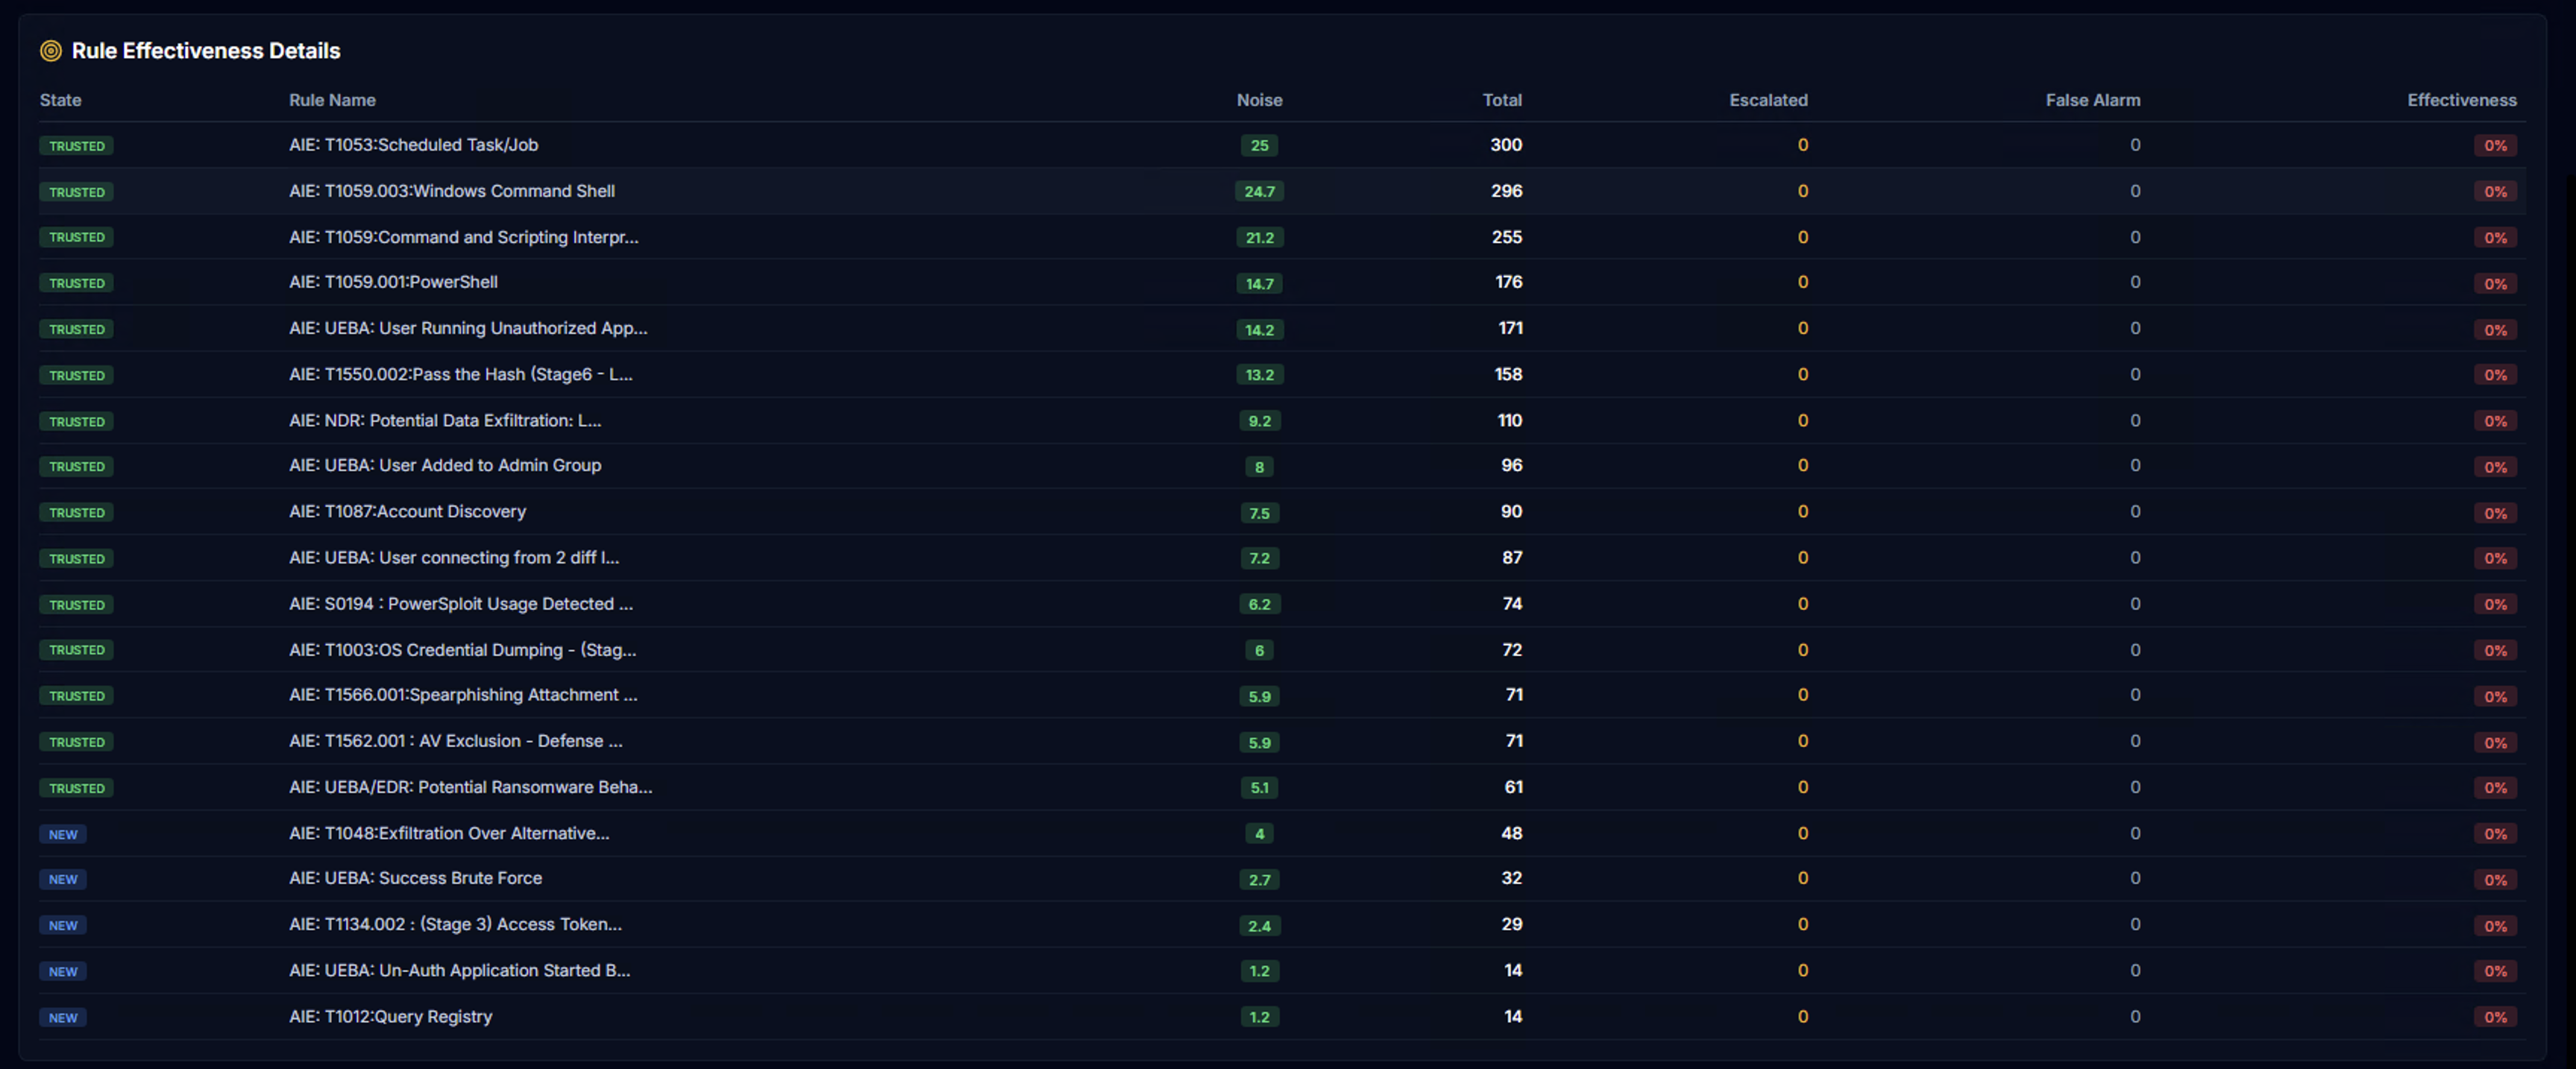
The Rule Effectiveness Details table tracks detection quality per rule:
| Column | Description |
|---|---|
| State | Rule lifecycle state — TRUSTED (green) or NEW (blue) |
| Rule Name | The alarm rule name |
| Noise | Noise score for this rule |
| Total | Total alarm count |
| Escalated | How many were escalated by analysts |
| False Alarm | How many were marked as false positives |
| Effectiveness | Percentage of alarms that led to escalation — higher = more effective |
Rule lifecycle states help identify which rules are delivering value and which need tuning.